
- Home >
- Stock Videos >
- Digital Global Data Visualization on Dark Background
Digital Global Data Visualization on Dark Background Video
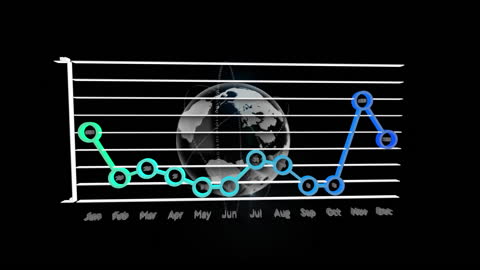
Digital graph representation in front of globe symbolizes analytics and global data sharing. Shows month-to-month changes with colored lines and dots. Use for presentations, educational resources or reports discussing technology, healthcare analytics, business trends or international datasets it encapsulates modern and global reach of data interpretation.

downloads
Tags:
More
Credit Photo
If you would like to credit the Photo, here are some ways you can do so
Text Link
video Link
<span class="text-link">
<span>
<a target="_blank" href=https://pikwizard.com/video/digital-global-data-visualization-on-dark-background/eb63c62503a8b28f3d2c298bcefb0f0b/>PikWizard</a>
</span>
</span>
<span class="image-link">
<span
style="margin: 0 0 20px 0; display: inline-block; vertical-align: middle; width: 100%;"
>
<a
target="_blank"
href="https://pikwizard.com/video/digital-global-data-visualization-on-dark-background/eb63c62503a8b28f3d2c298bcefb0f0b/"
style="text-decoration: none; font-size: 10px; margin: 0;"
>
<video controls style="width: 100%; margin: 0;">
<source src="https://player.vimeo.com/progressive_redirect/playback/731297386/rendition/240p/file.mp4?loc=external&oauth2_token_id=1223210874&signature=f130e8f6d0cfb7a312e2201d10117615f905949d601c688a9e2d339a7430b235" type="video/mp4"
poster="https://pikwizard.com/pw/medium/eb63c62503a8b28f3d2c298bcefb0f0b.jpg"/>
Your browser does not support the video tag.
</video>
<p style="font-size: 12px; margin: 0;">PikWizard</p>
</a>
</span>
</span>
Free (free of charge)
Free for personal and commercial use.
Author: Awesome Content