
- Home >
- Stock Videos >
- Digital Graphs and Molecules with Abstract Finance Data
Digital Graphs and Molecules with Abstract Finance Data Video
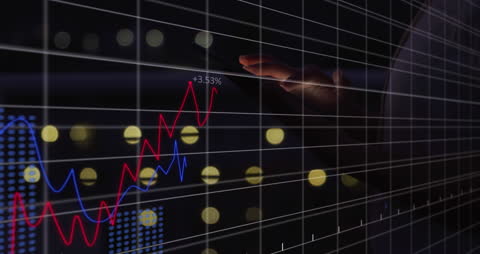
Capturing the fusion of technology and finance with dynamic graphs and data displays overlaying visual representations of molecules. Useful for illustrating concepts in finance, data analytics, and scientific research in presentations, websites, or educational materials that highlight modern trends in technological advancements and financial markets.

downloads
Tags:
More
Credit Photo
If you would like to credit the Photo, here are some ways you can do so
Text Link
video Link
<span class="text-link">
<span>
<a target="_blank" href=https://pikwizard.com/video/digital-graphs-and-molecules-with-abstract-finance-data/87937aa313db1e527cbef2bd276e83b5/>PikWizard</a>
</span>
</span>
<span class="image-link">
<span
style="margin: 0 0 20px 0; display: inline-block; vertical-align: middle; width: 100%;"
>
<a
target="_blank"
href="https://pikwizard.com/video/digital-graphs-and-molecules-with-abstract-finance-data/87937aa313db1e527cbef2bd276e83b5/"
style="text-decoration: none; font-size: 10px; margin: 0;"
>
<video controls style="width: 100%; margin: 0;">
<source src="https://player.vimeo.com/progressive_redirect/playback/912398878/rendition/240p/file.mp4?loc=external&oauth2_token_id=1223210874&signature=e1496f7fc8a0389adab23afa34c2b9f71a3ed2e41c50bfddb69855f76afd90a3" type="video/mp4"
poster="https://pikwizard.com/pw/medium/87937aa313db1e527cbef2bd276e83b5.jpg"/>
Your browser does not support the video tag.
</video>
<p style="font-size: 12px; margin: 0;">PikWizard</p>
</a>
</span>
</span>
Free (free of charge)
Free for personal and commercial use.
Author: Awesome Content