
- Home >
- Stock Videos >
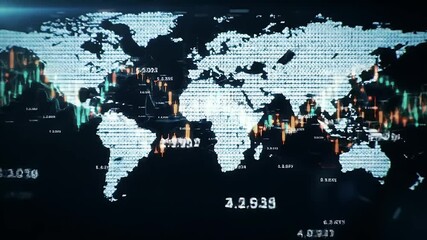
- Digital Graphs and World Map Overlay for Global Finance Analysis
Digital Graphs and World Map Overlay for Global Finance Analysis Video

Digital graphical overlay of financial charts blended with a world map conveys complex data and global trends in an engaging way. Ideal for illustrating concepts related to economics, business technologies, global trade, or investment finance. Useful for presentations, articles, blog posts, and websites focusing on international finance or advancements in technology.
Powered by 


0
downloads
downloads
Tags:
More
Credit Photo
If you would like to credit the Photo, here are some ways you can do so
Text Link
video Link
<span class="text-link">
<span>
<a target="_blank" href=https://pikwizard.com/video/digital-graphs-and-world-map-overlay-for-global-finance-analysis/39cb52db6f59612d96233a2890ab377e/>PikWizard</a>
</span>
</span>
<span class="image-link">
<span
style="margin: 0 0 20px 0; display: inline-block; vertical-align: middle; width: 100%;"
>
<a
target="_blank"
href="https://pikwizard.com/video/digital-graphs-and-world-map-overlay-for-global-finance-analysis/39cb52db6f59612d96233a2890ab377e/"
style="text-decoration: none; font-size: 10px; margin: 0;"
>
<video controls style="width: 100%; margin: 0;">
<source src="https://player.vimeo.com/progressive_redirect/playback/736327871/rendition/240p/file.mp4?loc=external&oauth2_token_id=1223210874&signature=69d11cc85180a37c92d1ee4bb12fbb41f384f7e9065431f0fae1a9d817c0eda5" type="video/mp4"
poster="https://pikwizard.com/pw/medium/39cb52db6f59612d96233a2890ab377e.jpg"/>
Your browser does not support the video tag.
</video>
<p style="font-size: 12px; margin: 0;">PikWizard</p>
</a>
</span>
</span>
Free (free of charge)
Free for personal and commercial use.
Author: Awesome Content