
- Home >
- Stock Videos >
- Digital Graphs Representing Data Analysis and Trends
Digital Graphs Representing Data Analysis and Trends Video
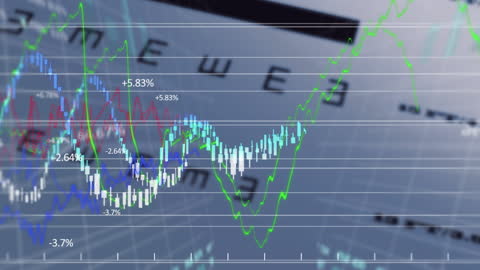
Data charts showcasing fluctuating market trends and analytics. Useful for presentations on finance, business analytics, investment strategies, and technology innovations. The overlapping graphs highlight process and fluctuation, appealing to audiences interested in data science, process automation, and digital visualization techniques.

downloads
Tags:
More
Credit Photo
If you would like to credit the Photo, here are some ways you can do so
Text Link
video Link
<span class="text-link">
<span>
<a target="_blank" href=https://pikwizard.com/video/digital-graphs-representing-data-analysis-and-trends/d910a63f0f0e8587b6e764c5dc4c4bef/>PikWizard</a>
</span>
</span>
<span class="image-link">
<span
style="margin: 0 0 20px 0; display: inline-block; vertical-align: middle; width: 100%;"
>
<a
target="_blank"
href="https://pikwizard.com/video/digital-graphs-representing-data-analysis-and-trends/d910a63f0f0e8587b6e764c5dc4c4bef/"
style="text-decoration: none; font-size: 10px; margin: 0;"
>
<video controls style="width: 100%; margin: 0;">
<source src="https://player.vimeo.com/progressive_redirect/playback/910602073/rendition/240p/file.mp4?loc=external&oauth2_token_id=1223210874&signature=18b5215a63e855a6db2f36600124f5be77a353c67e2ebdd9dad715af986cf167" type="video/mp4"
poster="https://pikwizard.com/pw/medium/d910a63f0f0e8587b6e764c5dc4c4bef.jpg"/>
Your browser does not support the video tag.
</video>
<p style="font-size: 12px; margin: 0;">PikWizard</p>
</a>
</span>
</span>
Free (free of charge)
Free for personal and commercial use.
Author: Awesome Content