
- Home >
- Stock Videos >
- Digital Green Financial Graph Interface with Rising Data
Digital Green Financial Graph Interface with Rising Data Video
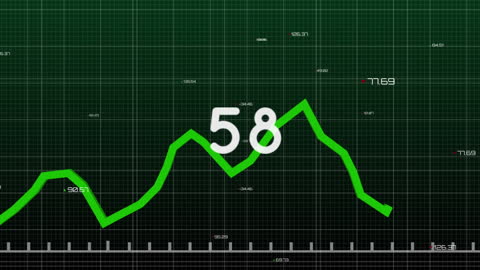
This abstract graphical representation displays financial data trends on a digital interface with a green background. Numbers increase dynamically, suggesting upward trends often associated with growth in financial contexts. Ideal for use in multimedia art, business presentations, finance reports, technology expositions, or educational content related to economic and financial studies.
Powered by 


downloads
Tags:
More
Credit Photo
If you would like to credit the Photo, here are some ways you can do so
Text Link
video Link
<span class="text-link">
<span>
<a target="_blank" href=https://pikwizard.com/video/digital-green-financial-graph-interface-with-rising-data/3b1f3f7032cf3d65457f00913a96054c/>PikWizard</a>
</span>
</span>
<span class="image-link">
<span
style="margin: 0 0 20px 0; display: inline-block; vertical-align: middle; width: 100%;"
>
<a
target="_blank"
href="https://pikwizard.com/video/digital-green-financial-graph-interface-with-rising-data/3b1f3f7032cf3d65457f00913a96054c/"
style="text-decoration: none; font-size: 10px; margin: 0;"
>
<video controls style="width: 100%; margin: 0;">
<source src="https://player.vimeo.com/progressive_redirect/playback/736760674/rendition/240p/file.mp4?loc=external&oauth2_token_id=1223210874&signature=767518bfbd7301fab34bb47341d8239a91547d95edec014bf0bf24cfa3705066" type="video/mp4"
poster="https://pikwizard.com/pw/medium/3b1f3f7032cf3d65457f00913a96054c.jpg"/>
Your browser does not support the video tag.
</video>
<p style="font-size: 12px; margin: 0;">PikWizard</p>
</a>
</span>
</span>
Free (free of charge)
Free for personal and commercial use.
Author: Awesome Content