
- Home >
- Stock Videos >
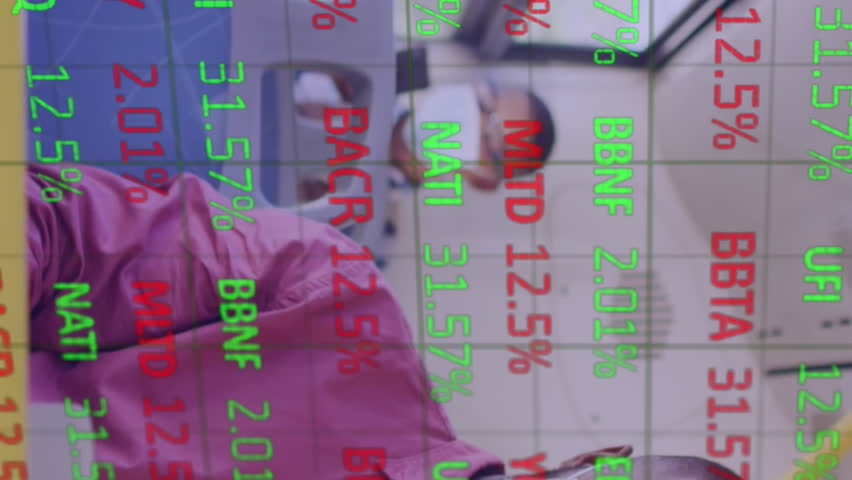
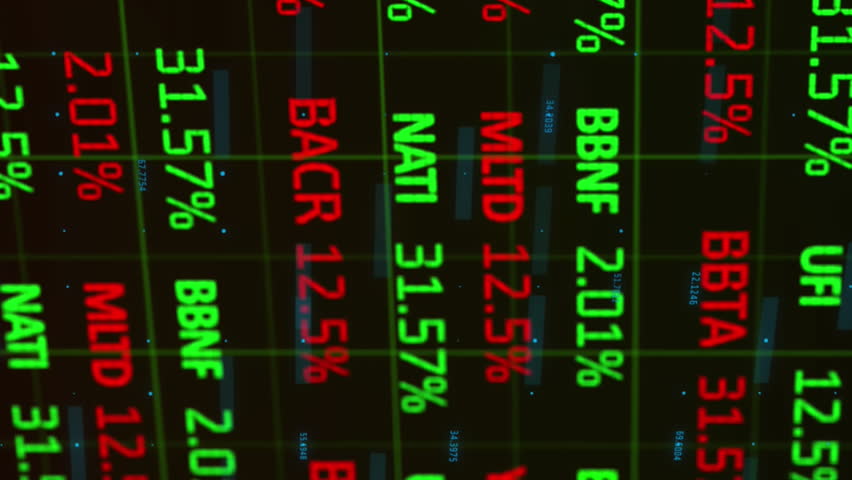
- Digital Icons Overlapping with Stock Market Data Chart
Digital Icons Overlapping with Stock Market Data Chart Video

Illustrates digital icons interacting with stock market charts symbolizing technology-driven financial analysis. Useful for articles or presentations on business networking, fintech advancements, or the future of financial data processing.
Powered by  - Get 15% off with code: PIKWIZARD15


0
downloads
downloads
Tags:
More
Credit Photo
If you would like to credit the Photo, here are some ways you can do so
Text Link
video Link
<span class="text-link">
<span>
<a target="_blank" href=https://pikwizard.com/video/digital-icons-overlapping-with-stock-market-data-chart/1464fc644a63b828d956a4cdf6a8f7f2/>PikWizard</a>
</span>
</span>
<span class="image-link">
<span
style="margin: 0 0 20px 0; display: inline-block; vertical-align: middle; width: 100%;"
>
<a
target="_blank"
href="https://pikwizard.com/video/digital-icons-overlapping-with-stock-market-data-chart/1464fc644a63b828d956a4cdf6a8f7f2/"
style="text-decoration: none; font-size: 10px; margin: 0;"
>
<video controls style="width: 100%; margin: 0;">
<source src="https://player.vimeo.com/progressive_redirect/playback/790453327/rendition/240p/file.mp4?loc=external&oauth2_token_id=1223210874&signature=c605c2e0cf9d3fe05b8305c4e4902a94df4612f76d6130d3c87420150602020b" type="video/mp4"
poster="https://pikwizard.com/pw/medium/1464fc644a63b828d956a4cdf6a8f7f2.jpg"/>
Your browser does not support the video tag.
</video>
<p style="font-size: 12px; margin: 0;">PikWizard</p>
</a>
</span>
</span>
Free (free of charge)
Free for personal and commercial use.
Author: Awesome Content