
- Home >
- Stock Videos >
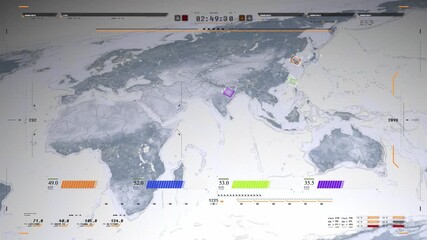
- Digital Infographic with Globe and Data Charts
Digital Infographic with Globe and Data Charts Video

This illustration depicts a futuristic digital interface with an integrated globe and analytical graphs. Icons and statistics enlarging prospects of global digitization conjunct with cloud computing and AI technology are visible. Useful in tech industry articles, global communication promotions, business presentations focusing on innovative data management or digital advancements.
Powered by 


12
downloads
downloads
Tags:
More
Credit Photo
If you would like to credit the Photo, here are some ways you can do so
Text Link
video Link
<span class="text-link">
<span>
<a target="_blank" href=https://pikwizard.com/video/digital-infographic-with-globe-and-data-charts/a5b6ca7a4355c7831de4971285057970/>PikWizard</a>
</span>
</span>
<span class="image-link">
<span
style="margin: 0 0 20px 0; display: inline-block; vertical-align: middle; width: 100%;"
>
<a
target="_blank"
href="https://pikwizard.com/video/digital-infographic-with-globe-and-data-charts/a5b6ca7a4355c7831de4971285057970/"
style="text-decoration: none; font-size: 10px; margin: 0;"
>
<video controls style="width: 100%; margin: 0;">
<source src="https://player.vimeo.com/progressive_redirect/playback/741722157/rendition/240p/file.mp4?loc=external&oauth2_token_id=1223210874&signature=054c52ab5c0c768c268f1301b335efb37c9776f7c2932e9edfa1782c9dd2eb5d" type="video/mp4"
poster="https://pikwizard.com/pw/medium/a5b6ca7a4355c7831de4971285057970.jpg"/>
Your browser does not support the video tag.
</video>
<p style="font-size: 12px; margin: 0;">PikWizard</p>
</a>
</span>
</span>
Free (free of charge)
Free for personal and commercial use.
Author: Awesome Content