
- Home >
- Stock Videos >
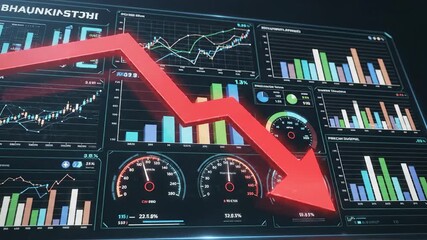
- Digital Interface Analyzing Financial Market Data
Digital Interface Analyzing Financial Market Data Video

Stylized representation depicts a digital interface analyzing financial market data. Circular futuristic graphic overlaying line charts marks focus on data analytics and technological sophistication. Ideal for using in content related to economics, stock market analysis, tech solutions in finance, or presentations on data-driven insights.
Powered by 


downloads
Tags:
More
Credit Photo
If you would like to credit the Photo, here are some ways you can do so
Text Link
video Link
<span class="text-link">
<span>
<a target="_blank" href=https://pikwizard.com/video/digital-interface-analyzing-financial-market-data/ef95fbe36380876cb25467f80340cdf0/>PikWizard</a>
</span>
</span>
<span class="image-link">
<span
style="margin: 0 0 20px 0; display: inline-block; vertical-align: middle; width: 100%;"
>
<a
target="_blank"
href="https://pikwizard.com/video/digital-interface-analyzing-financial-market-data/ef95fbe36380876cb25467f80340cdf0/"
style="text-decoration: none; font-size: 10px; margin: 0;"
>
<video controls style="width: 100%; margin: 0;">
<source src="https://player.vimeo.com/progressive_redirect/playback/814773127/rendition/240p/file.mp4?loc=external&oauth2_token_id=1223210874&signature=0e741a9aa118fbbf35190ab9b391696566d46178ddf7a85fedfe14420394b08d" type="video/mp4"
poster="https://pikwizard.com/pw/medium/ef95fbe36380876cb25467f80340cdf0.jpg"/>
Your browser does not support the video tag.
</video>
<p style="font-size: 12px; margin: 0;">PikWizard</p>
</a>
</span>
</span>
Free (free of charge)
Free for personal and commercial use.
Author: Awesome Content