
- Home >
- Stock Videos >
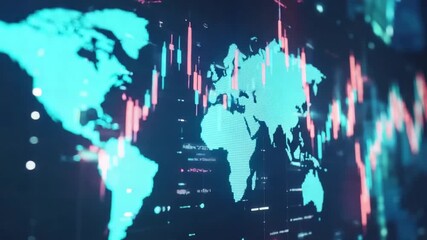
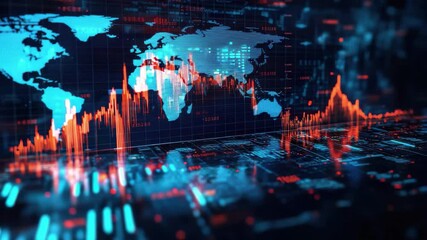
- Digital Interface Animation with Financial Data and Global Charts
Digital Interface Animation with Financial Data and Global Charts Video
Visualization of financial data on digital interfaces is useful for presentations and reports emphasizing global business strategies and technological advancements. Ideal for resources on artificial intelligence in finance, investment analytics, economic forecasts, and innovations in telecommunications. Suitable for marketing materials, tech articles, business slideshows, and educational content about data analysis and technological impact in the economy.
Powered by 


2
downloads
downloads
Tags:
More
Credit Photo
If you would like to credit the Photo, here are some ways you can do so
Text Link
video Link
<span class="text-link">
<span>
<a target="_blank" href=https://pikwizard.com/video/digital-interface-animation-with-financial-data-and-global-charts/3a17a5883621915b871a9e6707335e83/>PikWizard</a>
</span>
</span>
<span class="image-link">
<span
style="margin: 0 0 20px 0; display: inline-block; vertical-align: middle; width: 100%;"
>
<a
target="_blank"
href="https://pikwizard.com/video/digital-interface-animation-with-financial-data-and-global-charts/3a17a5883621915b871a9e6707335e83/"
style="text-decoration: none; font-size: 10px; margin: 0;"
>
<video controls style="width: 100%; margin: 0;">
<source src="https://player.vimeo.com/progressive_redirect/playback/741070947/rendition/360p/file.mp4?loc=external&oauth2_token_id=1223210874&signature=3a0f7d9045029015e4f6f5f68b8ff60bc8521e14435dee3adab0ced124b53c74" type="video/mp4"
poster="https://pikwizard.com/pw/medium/3a17a5883621915b871a9e6707335e83.jpg"/>
Your browser does not support the video tag.
</video>
<p style="font-size: 12px; margin: 0;">PikWizard</p>
</a>
</span>
</span>
Free (free of charge)
Free for personal and commercial use.
Author: Awesome Content