
- Home >
- Stock Videos >
- Digital Interface Animation with Red Line Finance Analytics
Digital Interface Animation with Red Line Finance Analytics Video
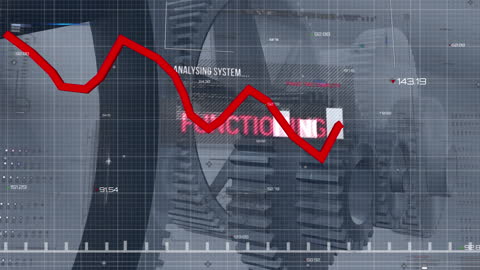
Animation features dynamic digital interface with a prominent red line suggesting financial data analysis. Moving cogs and graphical elements emphasize the business and technology focus. Useful for presentations on finance technology, market analysis, or data processing technologies.
Powered by 


downloads
Tags:
More
Credit Photo
If you would like to credit the Photo, here are some ways you can do so
Text Link
video Link
<span class="text-link">
<span>
<a target="_blank" href=https://pikwizard.com/video/digital-interface-animation-with-red-line-finance-analytics/ccbf78391f0cf3ca5c221adf97dd86a8/>PikWizard</a>
</span>
</span>
<span class="image-link">
<span
style="margin: 0 0 20px 0; display: inline-block; vertical-align: middle; width: 100%;"
>
<a
target="_blank"
href="https://pikwizard.com/video/digital-interface-animation-with-red-line-finance-analytics/ccbf78391f0cf3ca5c221adf97dd86a8/"
style="text-decoration: none; font-size: 10px; margin: 0;"
>
<video controls style="width: 100%; margin: 0;">
<source src="https://player.vimeo.com/progressive_redirect/playback/746400683/rendition/240p/file.mp4?loc=external&oauth2_token_id=1223210874&signature=4f64f6ef80edfde012e41e786fa78da5c8ddf8bc0ef879e0506f9742b0e138e0" type="video/mp4"
poster="https://pikwizard.com/pw/medium/ccbf78391f0cf3ca5c221adf97dd86a8.jpg"/>
Your browser does not support the video tag.
</video>
<p style="font-size: 12px; margin: 0;">PikWizard</p>
</a>
</span>
</span>
Free (free of charge)
Free for personal and commercial use.
Author: Awesome Content