
- Home >
- Stock Videos >
- Digital Interface Dashboard with Transparent Data Visualizations
Digital Interface Dashboard with Transparent Data Visualizations Video
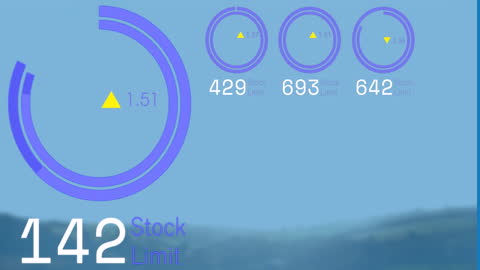
This illustrates a digital interface with data processing visualizations overlaying a faint landscape. The innovative display shows stock limits and other metrics with blue circular graphs and numeric indicators. Useful for presentations or marketing materials focused on technology, digital transformations, and data analytics.

downloads
Tags:
More
Credit Photo
If you would like to credit the Photo, here are some ways you can do so
Text Link
video Link
<span class="text-link">
<span>
<a target="_blank" href=https://pikwizard.com/video/digital-interface-dashboard-with-transparent-data-visualizations/e8455e4b6c2fcc363bba6d22aa31bec3/>PikWizard</a>
</span>
</span>
<span class="image-link">
<span
style="margin: 0 0 20px 0; display: inline-block; vertical-align: middle; width: 100%;"
>
<a
target="_blank"
href="https://pikwizard.com/video/digital-interface-dashboard-with-transparent-data-visualizations/e8455e4b6c2fcc363bba6d22aa31bec3/"
style="text-decoration: none; font-size: 10px; margin: 0;"
>
<video controls style="width: 100%; margin: 0;">
<source src="https://player.vimeo.com/progressive_redirect/playback/908018923/rendition/240p/file.mp4?loc=external&oauth2_token_id=1223210874&signature=328c47f185ce64f7bf0ddbb37a7368af19210e63fd41839babb7e8b2cc31f08e" type="video/mp4"
poster="https://pikwizard.com/pw/medium/e8455e4b6c2fcc363bba6d22aa31bec3.jpg"/>
Your browser does not support the video tag.
</video>
<p style="font-size: 12px; margin: 0;">PikWizard</p>
</a>
</span>
</span>
Free (free of charge)
Free for personal and commercial use.
Author: Awesome Content