
- Home >
- Stock Videos >
- Digital Interface Displaying Financial Data Analysis
Digital Interface Displaying Financial Data Analysis Video
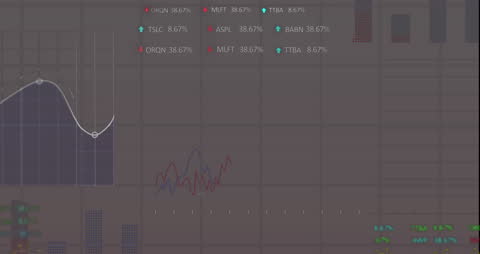
Featuring animated financial data on a digital grey background, this visually appealing representation illustrates the dynamic and complex nature of contemporary finance analysis tasks. Useful for presentations, financial literacy training, stock market analysis articles, fintech marketing, and news relating to global financial markets, the visual emphasizes technology-driven data interpretation in the financial industry.

downloads
Tags:
More
Credit Photo
If you would like to credit the Photo, here are some ways you can do so
Text Link
video Link
<span class="text-link">
<span>
<a target="_blank" href=https://pikwizard.com/video/digital-interface-displaying-financial-data-analysis/aec12204a434b0900b47e1fba0eb9156/>PikWizard</a>
</span>
</span>
<span class="image-link">
<span
style="margin: 0 0 20px 0; display: inline-block; vertical-align: middle; width: 100%;"
>
<a
target="_blank"
href="https://pikwizard.com/video/digital-interface-displaying-financial-data-analysis/aec12204a434b0900b47e1fba0eb9156/"
style="text-decoration: none; font-size: 10px; margin: 0;"
>
<video controls style="width: 100%; margin: 0;">
<source src="https://player.vimeo.com/progressive_redirect/playback/767119708/rendition/240p/file.mp4?loc=external&oauth2_token_id=1223210874&signature=84e62b3e86b63af4f321a384748ccfa93d14f83fca7d6ed7b3a4a896b3cd2fe0" type="video/mp4"
poster="https://pikwizard.com/pw/medium/aec12204a434b0900b47e1fba0eb9156.jpg"/>
Your browser does not support the video tag.
</video>
<p style="font-size: 12px; margin: 0;">PikWizard</p>
</a>
</span>
</span>
Free (free of charge)
Free for personal and commercial use.
Author: Awesome Content