
- Home >
- Stock Videos >
- Digital Interface Visualizing City Financial Data Dynamics
Digital Interface Visualizing City Financial Data Dynamics Video
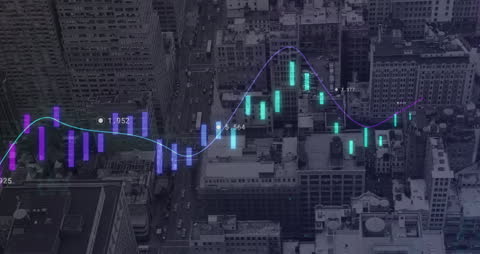
Complex financial data superimposed over a city, capturing real-time market trends intertwined with urban environment. Ideal for presentations or promotions related to fintech, stock market strategies, and urban data management technology.

downloads
Tags:
More
Credit Photo
If you would like to credit the Photo, here are some ways you can do so
Text Link
video Link
<span class="text-link">
<span>
<a target="_blank" href=https://pikwizard.com/video/digital-interface-visualizing-city-financial-data-dynamics/f51aab97a2815cee503af875e9c585a1/>PikWizard</a>
</span>
</span>
<span class="image-link">
<span
style="margin: 0 0 20px 0; display: inline-block; vertical-align: middle; width: 100%;"
>
<a
target="_blank"
href="https://pikwizard.com/video/digital-interface-visualizing-city-financial-data-dynamics/f51aab97a2815cee503af875e9c585a1/"
style="text-decoration: none; font-size: 10px; margin: 0;"
>
<video controls style="width: 100%; margin: 0;">
<source src="https://player.vimeo.com/progressive_redirect/playback/756035266/rendition/240p/file.mp4?loc=external&oauth2_token_id=1223210874&signature=fcbbbbf8c44387e699669a79d0da581a6fe8c9f0914cc9bea0a33ee161d705c0" type="video/mp4"
poster="https://pikwizard.com/pw/medium/f51aab97a2815cee503af875e9c585a1.jpg"/>
Your browser does not support the video tag.
</video>
<p style="font-size: 12px; margin: 0;">PikWizard</p>
</a>
</span>
</span>
Free (free of charge)
Free for personal and commercial use.
Author: Awesome Content