
- Home >
- Stock Videos >
- Digital Interface with Data Visualization Overlay
Digital Interface with Data Visualization Overlay Video
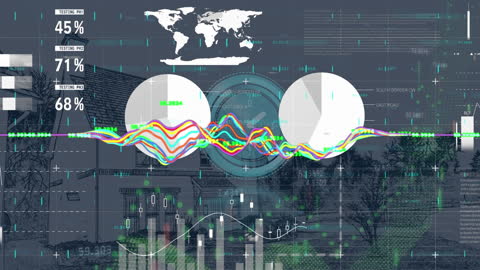
Depicts data analytics and technology integration with a global business perspective. Features layered visuals of charts and graphic data around a digital clock. Ideal for representing technology industry advancements, data reporting, business forecasting, and modern digital applications.

downloads
Tags:
More
Credit Photo
If you would like to credit the Photo, here are some ways you can do so
Text Link
video Link
<span class="text-link">
<span>
<a target="_blank" href=https://pikwizard.com/video/digital-interface-with-data-visualization-overlay/3adcdbfb5fc0c5d4b35e3918f9cfedcd/>PikWizard</a>
</span>
</span>
<span class="image-link">
<span
style="margin: 0 0 20px 0; display: inline-block; vertical-align: middle; width: 100%;"
>
<a
target="_blank"
href="https://pikwizard.com/video/digital-interface-with-data-visualization-overlay/3adcdbfb5fc0c5d4b35e3918f9cfedcd/"
style="text-decoration: none; font-size: 10px; margin: 0;"
>
<video controls style="width: 100%; margin: 0;">
<source src="https://player.vimeo.com/progressive_redirect/playback/769026526/rendition/240p/file.mp4?loc=external&oauth2_token_id=1223210874&signature=1fee5fd2a22f080342daabf2cb3d52c2e91ba45e6235dd7fb79cda88bebbaf1f" type="video/mp4"
poster="https://pikwizard.com/pw/medium/3adcdbfb5fc0c5d4b35e3918f9cfedcd.jpg"/>
Your browser does not support the video tag.
</video>
<p style="font-size: 12px; margin: 0;">PikWizard</p>
</a>
</span>
</span>
Free (free of charge)
Free for personal and commercial use.
Author: Awesome Content