
- Home >
- Stock Videos >
- Digital Interface with Financial Data Symbols and Graphs
Digital Interface with Financial Data Symbols and Graphs Video
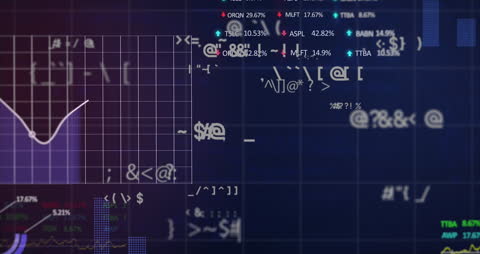
The illustration displays an array of financial symbols, data points, and graphical elements associated with stock market statistics and data analysis. Ideal for use in materials focused on global trading, modern finance technology, or financial data trends analysis.

downloads
Tags:
More
Credit Photo
If you would like to credit the Photo, here are some ways you can do so
Text Link
video Link
<span class="text-link">
<span>
<a target="_blank" href=https://pikwizard.com/video/digital-interface-with-financial-data-symbols-and-graphs/cce01541516a6bf3794c5ea3e0a96388/>PikWizard</a>
</span>
</span>
<span class="image-link">
<span
style="margin: 0 0 20px 0; display: inline-block; vertical-align: middle; width: 100%;"
>
<a
target="_blank"
href="https://pikwizard.com/video/digital-interface-with-financial-data-symbols-and-graphs/cce01541516a6bf3794c5ea3e0a96388/"
style="text-decoration: none; font-size: 10px; margin: 0;"
>
<video controls style="width: 100%; margin: 0;">
<source src="https://player.vimeo.com/progressive_redirect/playback/788497901/rendition/240p/file.mp4?loc=external&oauth2_token_id=1223210874&signature=b60a60b83a77200d9446bfbdad0903261bfb3bd412ffbea434857971a198db8b" type="video/mp4"
poster="https://pikwizard.com/pw/medium/cce01541516a6bf3794c5ea3e0a96388.jpg"/>
Your browser does not support the video tag.
</video>
<p style="font-size: 12px; margin: 0;">PikWizard</p>
</a>
</span>
</span>
Free (free of charge)
Free for personal and commercial use.
Author: Awesome Content