
- Home >
- Stock Videos >
- Digital Interface with Financial Graphs and Data Visualization
Digital Interface with Financial Graphs and Data Visualization Video
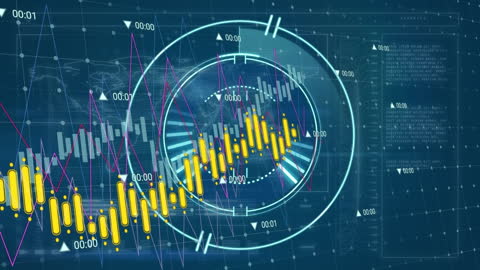
Digital interface showing financial charts and data on a blue background. It includes advanced analytics and information displayed virtually with a modern, futuristic design. Ideal for use in technology, investment, fintech presentations, educational materials focusing on global markets, and data processing visuals.
Powered by  - Get 15% off with code: PIKWIZARD15


downloads
Tags:
More
Credit Photo
If you would like to credit the Photo, here are some ways you can do so
Text Link
video Link
<span class="text-link">
<span>
<a target="_blank" href=https://pikwizard.com/video/digital-interface-with-financial-graphs-and-data-visualization/bd64567f0a009c5887dea7aff01067de/>PikWizard</a>
</span>
</span>
<span class="image-link">
<span
style="margin: 0 0 20px 0; display: inline-block; vertical-align: middle; width: 100%;"
>
<a
target="_blank"
href="https://pikwizard.com/video/digital-interface-with-financial-graphs-and-data-visualization/bd64567f0a009c5887dea7aff01067de/"
style="text-decoration: none; font-size: 10px; margin: 0;"
>
<video controls style="width: 100%; margin: 0;">
<source src="https://player.vimeo.com/progressive_redirect/playback/758981392/rendition/240p/file.mp4?loc=external&oauth2_token_id=1223210874&signature=bb8904bd920ff740211734e89d3f2e481ed62bff3b89ae0711ea4370444a9e99" type="video/mp4"
poster="https://pikwizard.com/pw/medium/bd64567f0a009c5887dea7aff01067de.jpg"/>
Your browser does not support the video tag.
</video>
<p style="font-size: 12px; margin: 0;">PikWizard</p>
</a>
</span>
</span>
Free (free of charge)
Free for personal and commercial use.
Author: Awesome Content