
- Home >
- Stock Videos >
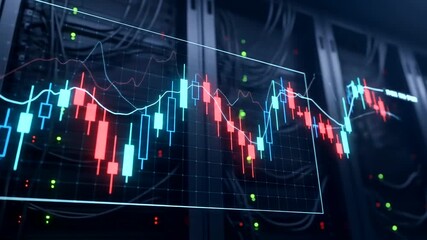
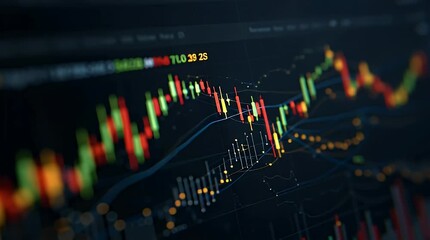
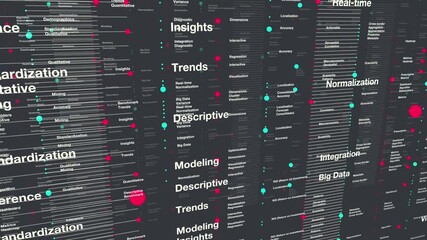
- Digital Interface with Financial Graphs and Data
Digital Interface with Financial Graphs and Data Video

Dynamic visual representation focuses on depicting complex financial data with modern, digital graphics. Ideal for illustrating financial analysis, economic trends or stock market interfaces. Useful for articles, presentations or content needing a futuristic, high-tech aesthetic feel emphasizing data analytics and business forecasting.
Powered by 


downloads
Tags:
More
Credit Photo
If you would like to credit the Photo, here are some ways you can do so
Text Link
video Link
<span class="text-link">
<span>
<a target="_blank" href=https://pikwizard.com/video/digital-interface-with-financial-graphs-and-data/81d7b7d189b1202574f91ce28c57a4e5/>PikWizard</a>
</span>
</span>
<span class="image-link">
<span
style="margin: 0 0 20px 0; display: inline-block; vertical-align: middle; width: 100%;"
>
<a
target="_blank"
href="https://pikwizard.com/video/digital-interface-with-financial-graphs-and-data/81d7b7d189b1202574f91ce28c57a4e5/"
style="text-decoration: none; font-size: 10px; margin: 0;"
>
<video controls style="width: 100%; margin: 0;">
<source src="https://player.vimeo.com/progressive_redirect/playback/739139249/rendition/240p/file.mp4?loc=external&oauth2_token_id=1223210874&signature=431426fc3eeb6255c407396776502ec11c27246ed03b98444cd59ade93d3817e" type="video/mp4"
poster="https://pikwizard.com/pw/medium/81d7b7d189b1202574f91ce28c57a4e5.jpg"/>
Your browser does not support the video tag.
</video>
<p style="font-size: 12px; margin: 0;">PikWizard</p>
</a>
</span>
</span>
Free (free of charge)
Free for personal and commercial use.
Author: Awesome Content