
- Home >
- Stock Videos >
- Digital Monitoring of Increasing Financial Trend on Interface
Digital Monitoring of Increasing Financial Trend on Interface Video
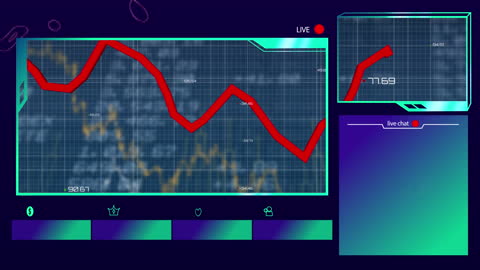
Intertwining graphs over complex technical interface convey a message success and business momentum. Great for articles or presentations related to stock markets, financial analytics, and monitoring systems. This visualization can effectively illustrate the dynamic nature of global business trends and modern technical analysis approaches.
Powered by 


1
downloads
downloads
Tags:
More
Credit Photo
If you would like to credit the Photo, here are some ways you can do so
Text Link
video Link
<span class="text-link">
<span>
<a target="_blank" href=https://pikwizard.com/video/digital-monitoring-of-increasing-financial-trend-on-interface/1f676fd8387e62a3fcad3b7d5ded03c2/>PikWizard</a>
</span>
</span>
<span class="image-link">
<span
style="margin: 0 0 20px 0; display: inline-block; vertical-align: middle; width: 100%;"
>
<a
target="_blank"
href="https://pikwizard.com/video/digital-monitoring-of-increasing-financial-trend-on-interface/1f676fd8387e62a3fcad3b7d5ded03c2/"
style="text-decoration: none; font-size: 10px; margin: 0;"
>
<video controls style="width: 100%; margin: 0;">
<source src="https://player.vimeo.com/progressive_redirect/playback/769950286/rendition/240p/file.mp4?loc=external&oauth2_token_id=1223210874&signature=62d8716c5cc8646a9941d0c12b2bf33dd1f6623e377f2154347f947d43d1ae00" type="video/mp4"
poster="https://pikwizard.com/pw/medium/1f676fd8387e62a3fcad3b7d5ded03c2.jpg"/>
Your browser does not support the video tag.
</video>
<p style="font-size: 12px; margin: 0;">PikWizard</p>
</a>
</span>
</span>
Free (free of charge)
Free for personal and commercial use.
Author: Awesome Content