
- Home >
- Stock Videos >
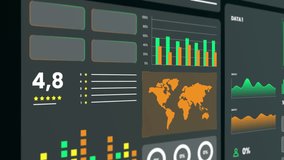
- Digital Screen with Global Data and Graphs Visualization
Digital Screen with Global Data and Graphs Visualization Video

Digital interfaces show a detailed compilation of global data statistics and tabular graphs, all presented on a striking navy blueprint style background. It creates an atmosphere of technological advancement and strategic financial planning. Use it for finance, research presentations, technology demonstrations, or business analytics themes to embody a forward-thinking, data-driven approach.
Powered by  - Get 15% off with code: PIKWIZARD15


downloads
Tags:
More
Credit Photo
If you would like to credit the Photo, here are some ways you can do so
Text Link
video Link
<span class="text-link">
<span>
<a target="_blank" href=https://pikwizard.com/video/digital-screen-with-global-data-and-graphs-visualization/6ca4f923f4f0d8eacfc673ba2304e215/>PikWizard</a>
</span>
</span>
<span class="image-link">
<span
style="margin: 0 0 20px 0; display: inline-block; vertical-align: middle; width: 100%;"
>
<a
target="_blank"
href="https://pikwizard.com/video/digital-screen-with-global-data-and-graphs-visualization/6ca4f923f4f0d8eacfc673ba2304e215/"
style="text-decoration: none; font-size: 10px; margin: 0;"
>
<video controls style="width: 100%; margin: 0;">
<source src="https://player.vimeo.com/progressive_redirect/playback/743817282/rendition/240p/file.mp4?loc=external&oauth2_token_id=1223210874&signature=3db1c05686dcf8a9676817a2a77f1423d5dc04ba6a951d53ac8f6425b959c2be" type="video/mp4"
poster="https://pikwizard.com/pw/medium/6ca4f923f4f0d8eacfc673ba2304e215.jpg"/>
Your browser does not support the video tag.
</video>
<p style="font-size: 12px; margin: 0;">PikWizard</p>
</a>
</span>
</span>
Free (free of charge)
Free for personal and commercial use.
Author: Awesome Content