
- Home >
- Stock Videos >
- Digital Stock Market Data Analysis with Animated Processing Elements
Digital Stock Market Data Analysis with Animated Processing Elements Video
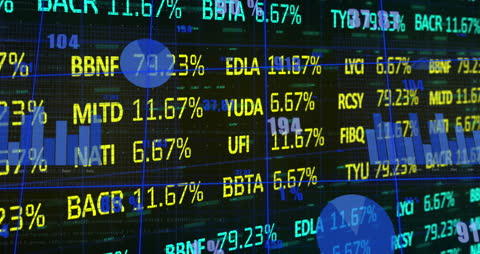
Colorful animation displays financial market percentages and codes over dark background, simulating active stock trading. Essential for presentations on global business strategies, economic forecasts, or financial analyses. Ideal for educational resources about stock market dynamics or background visuals for corporate videos related to finance and economic trends.
Powered by  - Get 15% off with code: PIKWIZARD15


downloads
Tags:
More
Credit Photo
If you would like to credit the Photo, here are some ways you can do so
Text Link
video Link
<span class="text-link">
<span>
<a target="_blank" href=https://pikwizard.com/video/digital-stock-market-data-analysis-with-animated-processing-elements/83052f4cd50b2aec104bd76580120ecc/>PikWizard</a>
</span>
</span>
<span class="image-link">
<span
style="margin: 0 0 20px 0; display: inline-block; vertical-align: middle; width: 100%;"
>
<a
target="_blank"
href="https://pikwizard.com/video/digital-stock-market-data-analysis-with-animated-processing-elements/83052f4cd50b2aec104bd76580120ecc/"
style="text-decoration: none; font-size: 10px; margin: 0;"
>
<video controls style="width: 100%; margin: 0;">
<source src="https://player.vimeo.com/progressive_redirect/playback/760271747/rendition/540p/file.mp4?loc=external&oauth2_token_id=1223210874&signature=df25e1d6e3e506537eb9b0f681056100b41748a7becab44a23d95964ca5f1944" type="video/mp4"
poster="https://pikwizard.com/pw/medium/83052f4cd50b2aec104bd76580120ecc.jpg"/>
Your browser does not support the video tag.
</video>
<p style="font-size: 12px; margin: 0;">PikWizard</p>
</a>
</span>
</span>
Free (free of charge)
Free for personal and commercial use.
Author: Awesome Content