
- Home >
- Stock Videos >
- Digital Stock Market Data Display in Virtual Interface
Digital Stock Market Data Display in Virtual Interface Video
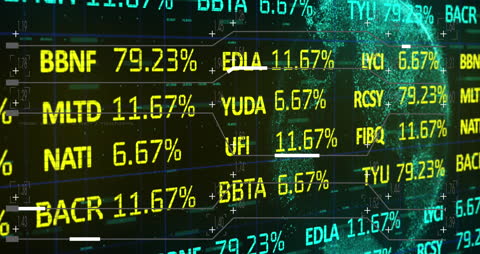
Visual representation of stock market data showing financial figures in an animated, digital display. Useful for conveying themes of finance, investment analytics, and technological interfaces. Perfect for banking, b-roll footage in documentaries, financial software demonstrations, and educational content about market trends.
Powered by 


downloads
Tags:
More
Credit Photo
If you would like to credit the Photo, here are some ways you can do so
Text Link
video Link
<span class="text-link">
<span>
<a target="_blank" href=https://pikwizard.com/video/digital-stock-market-data-display-in-virtual-interface/293f221bdd2b831e8979b083beed17b1/>PikWizard</a>
</span>
</span>
<span class="image-link">
<span
style="margin: 0 0 20px 0; display: inline-block; vertical-align: middle; width: 100%;"
>
<a
target="_blank"
href="https://pikwizard.com/video/digital-stock-market-data-display-in-virtual-interface/293f221bdd2b831e8979b083beed17b1/"
style="text-decoration: none; font-size: 10px; margin: 0;"
>
<video controls style="width: 100%; margin: 0;">
<source src="https://player.vimeo.com/progressive_redirect/playback/758252175/rendition/240p/file.mp4?loc=external&oauth2_token_id=1223210874&signature=43bbf35a88c9b4695815a72f4068f134bd00392af3bd53f62b7fbe15406156e0" type="video/mp4"
poster="https://pikwizard.com/pw/medium/293f221bdd2b831e8979b083beed17b1.jpg"/>
Your browser does not support the video tag.
</video>
<p style="font-size: 12px; margin: 0;">PikWizard</p>
</a>
</span>
</span>
Free (free of charge)
Free for personal and commercial use.
Author: Awesome Content