
- Home >
- Stock Videos >
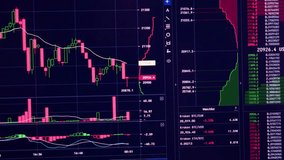
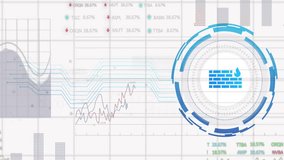
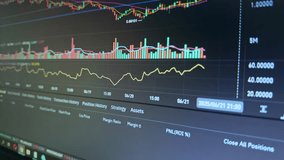
- Digital Stock Market Graphs with Security Interface Overlay
Digital Stock Market Graphs with Security Interface Overlay Video

Visual depicting stock market graphs overlaid with high-tech security system elements, illustrating complex correlational data patterns and cyber integration in finance. Useful for presentations on financial forecasting, cybersecurity in finance, trading systems, and technological innovations in stock markets.
Powered by  - Get 15% off with code: PIKWIZARD15


downloads
Tags:
More
Credit Photo
If you would like to credit the Photo, here are some ways you can do so
Text Link
video Link
<span class="text-link">
<span>
<a target="_blank" href=https://pikwizard.com/video/digital-stock-market-graphs-with-security-interface-overlay/ecab39c2b14c33f5a1e0238e5bb876aa/>PikWizard</a>
</span>
</span>
<span class="image-link">
<span
style="margin: 0 0 20px 0; display: inline-block; vertical-align: middle; width: 100%;"
>
<a
target="_blank"
href="https://pikwizard.com/video/digital-stock-market-graphs-with-security-interface-overlay/ecab39c2b14c33f5a1e0238e5bb876aa/"
style="text-decoration: none; font-size: 10px; margin: 0;"
>
<video controls style="width: 100%; margin: 0;">
<source src="https://player.vimeo.com/progressive_redirect/playback/717721039/rendition/240p/file.mp4?loc=external&oauth2_token_id=1223210874&signature=30de8eb858c0dc1b5cd513497d848fb42b9071c485fecf99ce4e9197aa04eb8c" type="video/mp4"
poster="https://pikwizard.com/pw/medium/ecab39c2b14c33f5a1e0238e5bb876aa.jpg"/>
Your browser does not support the video tag.
</video>
<p style="font-size: 12px; margin: 0;">PikWizard</p>
</a>
</span>
</span>
Free (free of charge)
Free for personal and commercial use.
Author: Awesome Content