
- Home >
- Stock Videos >
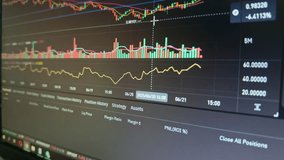
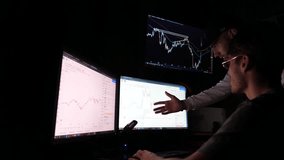
- Digital Stock Market Trading Blockchain Interface
Digital Stock Market Trading Blockchain Interface Video

Futuristic digital interface showing animated stock market tickers and graphs signifies a modern and dynamic trading environment. Perfect for business presentations, financial market training materials, stock analysis reports, and demonstrating technological integration in market analytics.
Powered by  - Get 15% off with code: PIKWIZARD15


downloads
Tags:
More
Credit Photo
If you would like to credit the Photo, here are some ways you can do so
Text Link
video Link
<span class="text-link">
<span>
<a target="_blank" href=https://pikwizard.com/video/digital-stock-market-trading-blockchain-interface/b559aa20567a3b4a5f01d94d817d596d/>PikWizard</a>
</span>
</span>
<span class="image-link">
<span
style="margin: 0 0 20px 0; display: inline-block; vertical-align: middle; width: 100%;"
>
<a
target="_blank"
href="https://pikwizard.com/video/digital-stock-market-trading-blockchain-interface/b559aa20567a3b4a5f01d94d817d596d/"
style="text-decoration: none; font-size: 10px; margin: 0;"
>
<video controls style="width: 100%; margin: 0;">
<source src="https://player.vimeo.com/progressive_redirect/playback/778594183/rendition/360p/file.mp4?loc=external&oauth2_token_id=1223210874&signature=ac72e943bb8aa82fab827a9bbd04f3c9091e15689570f344e20cf5ae776425a8" type="video/mp4"
poster="https://pikwizard.com/pw/medium/b559aa20567a3b4a5f01d94d817d596d.jpg"/>
Your browser does not support the video tag.
</video>
<p style="font-size: 12px; margin: 0;">PikWizard</p>
</a>
</span>
</span>
Free (free of charge)
Free for personal and commercial use.
Author: Awesome Content