
- Home >
- Stock Videos >
- Digital Stock Market Visualization with Graph and Data Points
Digital Stock Market Visualization with Graph and Data Points Video
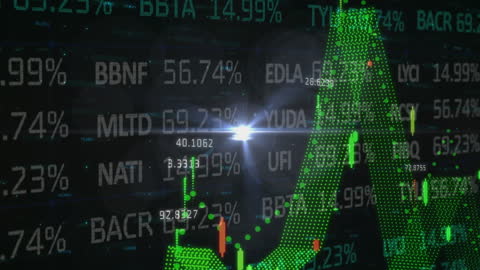
This animation presents a dynamic visualization of stock market trends and data points on a black background. Vivid green graphs and numerical values depict market movements, ideal for illustrating financial reports, economic trends, and investment strategies. Great for use in finance-related content, technology interfaces, and business presentation materials, this represents a modern approach to monitoring market fluctuations and data analytics.

downloads
Tags:
More
Credit Photo
If you would like to credit the Photo, here are some ways you can do so
Text Link
video Link
<span class="text-link">
<span>
<a target="_blank" href=https://pikwizard.com/video/digital-stock-market-visualization-with-graph-and-data-points/473133717318ab74ad41f7296a70a571/>PikWizard</a>
</span>
</span>
<span class="image-link">
<span
style="margin: 0 0 20px 0; display: inline-block; vertical-align: middle; width: 100%;"
>
<a
target="_blank"
href="https://pikwizard.com/video/digital-stock-market-visualization-with-graph-and-data-points/473133717318ab74ad41f7296a70a571/"
style="text-decoration: none; font-size: 10px; margin: 0;"
>
<video controls style="width: 100%; margin: 0;">
<source src="https://player.vimeo.com/progressive_redirect/playback/746391383/rendition/240p/file.mp4?loc=external&oauth2_token_id=1223210874&signature=51d202f6d6178b9d7d6bdbe28b6b39a68fbaee26e72de1ab3f7b2ea99e8440d5" type="video/mp4"
poster="https://pikwizard.com/pw/medium/473133717318ab74ad41f7296a70a571.jpg"/>
Your browser does not support the video tag.
</video>
<p style="font-size: 12px; margin: 0;">PikWizard</p>
</a>
</span>
</span>
Free (free of charge)
Free for personal and commercial use.
Author: Awesome Content