
- Home >
- Stock Videos >
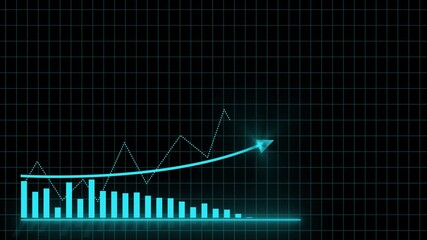
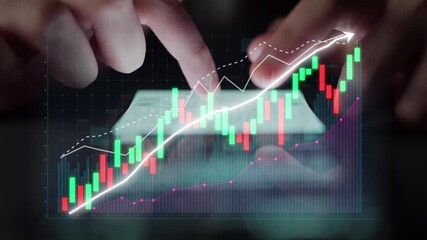
- Digital Visualization of Stock Market Data Fluctuations
Digital Visualization of Stock Market Data Fluctuations Video

Digital representation of stock market statistics overlaid with graphs and indices creating a techno-modern atmosphere. Suitable for financial presentations, investment advice contemplations, or illustrating concepts in global economic studies and business technology adaptations.
Powered by 


3
downloads
downloads
Tags:
More
Credit Photo
If you would like to credit the Photo, here are some ways you can do so
Text Link
video Link
<span class="text-link">
<span>
<a target="_blank" href=https://pikwizard.com/video/digital-visualization-of-stock-market-data-fluctuations/d5d617de7ca6b65e91693df810c3f79b/>PikWizard</a>
</span>
</span>
<span class="image-link">
<span
style="margin: 0 0 20px 0; display: inline-block; vertical-align: middle; width: 100%;"
>
<a
target="_blank"
href="https://pikwizard.com/video/digital-visualization-of-stock-market-data-fluctuations/d5d617de7ca6b65e91693df810c3f79b/"
style="text-decoration: none; font-size: 10px; margin: 0;"
>
<video controls style="width: 100%; margin: 0;">
<source src="https://player.vimeo.com/progressive_redirect/playback/760247655/rendition/240p/file.mp4?loc=external&oauth2_token_id=1223210874&signature=136cf3103cd2d19a694f596ea03ce8696f209b127ed64dff8fa7d071f32d35d1" type="video/mp4"
poster="https://pikwizard.com/pw/medium/d5d617de7ca6b65e91693df810c3f79b.jpg"/>
Your browser does not support the video tag.
</video>
<p style="font-size: 12px; margin: 0;">PikWizard</p>
</a>
</span>
</span>
Free (free of charge)
Free for personal and commercial use.
Author: Awesome Content