
- Home >
- Stock Videos >
- Digital World Map with Timelapse Integrated Data Charts
Digital World Map with Timelapse Integrated Data Charts Video
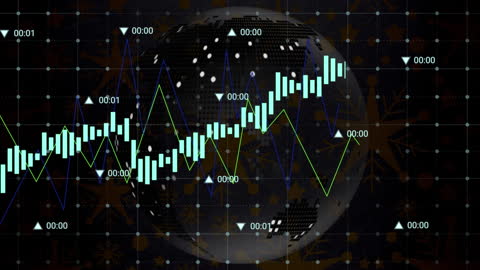
This visual concept combines a world map with various charts and diagrams, illustrating global economic trends and technological advancements. Ideal for presentations or reports on economic analysis, digital technology growth, or geography lessons explaining market dynamics. Can also be utilized in articles discussing global business strategies and innovations in digital communication paths.

downloads
Tags:
More
Credit Photo
If you would like to credit the Photo, here are some ways you can do so
Text Link
video Link
<span class="text-link">
<span>
<a target="_blank" href=https://pikwizard.com/video/digital-world-map-with-timelapse-integrated-data-charts/6a30088b4d7add7085c53fcdc9429873/>PikWizard</a>
</span>
</span>
<span class="image-link">
<span
style="margin: 0 0 20px 0; display: inline-block; vertical-align: middle; width: 100%;"
>
<a
target="_blank"
href="https://pikwizard.com/video/digital-world-map-with-timelapse-integrated-data-charts/6a30088b4d7add7085c53fcdc9429873/"
style="text-decoration: none; font-size: 10px; margin: 0;"
>
<video controls style="width: 100%; margin: 0;">
<source src="https://player.vimeo.com/progressive_redirect/playback/817800158/rendition/240p/file.mp4?loc=external&oauth2_token_id=1223210874&signature=5cc586a8e0e18f5449e8df6d12b7306241fc33d81503e5f42a362f5ba433ce37" type="video/mp4"
poster="https://pikwizard.com/pw/medium/6a30088b4d7add7085c53fcdc9429873.jpg"/>
Your browser does not support the video tag.
</video>
<p style="font-size: 12px; margin: 0;">PikWizard</p>
</a>
</span>
</span>
Free (free of charge)
Free for personal and commercial use.
Author: Awesome Content