
- Home >
- Stock Videos >
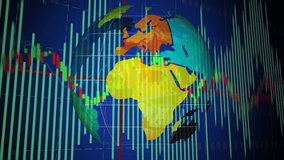
- Digital World of Finance with Neon Graphs and Data Charts
Digital World of Finance with Neon Graphs and Data Charts Video

This futuristic design features a digital globe surrounded by neon graphs and analytics, representing global financial data spreadsheets and trends. Perfect for use in technology-focused business presentations, financial market advertisements, or analytical writings on global economic patterns.
Powered by  - Get 15% off with code: PIKWIZARD15


1
downloads
downloads
Tags:
More
Credit Photo
If you would like to credit the Photo, here are some ways you can do so
Text Link
video Link
<span class="text-link">
<span>
<a target="_blank" href=https://pikwizard.com/video/digital-world-of-finance-with-neon-graphs-and-data-charts/ab339db86133fd91d268a6979bebb6ef/>PikWizard</a>
</span>
</span>
<span class="image-link">
<span
style="margin: 0 0 20px 0; display: inline-block; vertical-align: middle; width: 100%;"
>
<a
target="_blank"
href="https://pikwizard.com/video/digital-world-of-finance-with-neon-graphs-and-data-charts/ab339db86133fd91d268a6979bebb6ef/"
style="text-decoration: none; font-size: 10px; margin: 0;"
>
<video controls style="width: 100%; margin: 0;">
<source src="https://player.vimeo.com/progressive_redirect/playback/763042727/rendition/240p/file.mp4?loc=external&oauth2_token_id=1223210874&signature=2868078e578adb971298cdcfe79171eba1a974e06094235feab3eeea9109d53b" type="video/mp4"
poster="https://pikwizard.com/pw/medium/ab339db86133fd91d268a6979bebb6ef.jpg"/>
Your browser does not support the video tag.
</video>
<p style="font-size: 12px; margin: 0;">PikWizard</p>
</a>
</span>
</span>
Free (free of charge)
Free for personal and commercial use.
Author: Awesome Content