
- Home >
- Stock Videos >
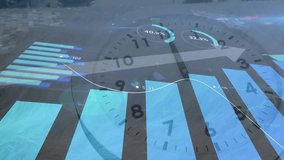
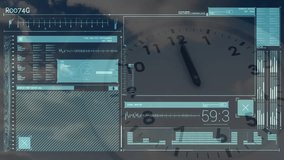
- Diverse Data Analytics Visualization with Clock Overlay in Motion
Diverse Data Analytics Visualization with Clock Overlay in Motion Video

Showing animated, overlapping graphical data and clocks creates a dynamic visualization suggesting global business and digital innovation. Rich, floating figures illustrate complexity and technological advancements, making it useful for presentations on financial reports, tech demos, and industry think pieces.
Powered by  - Get 15% off with code: PIKWIZARD15


downloads
Tags:
More
Credit Photo
If you would like to credit the Photo, here are some ways you can do so
Text Link
video Link
<span class="text-link">
<span>
<a target="_blank" href=https://pikwizard.com/video/diverse-data-analytics-visualization-with-clock-overlay-in-motion/feae81afd0f79d9e329cf410f0980c69/>PikWizard</a>
</span>
</span>
<span class="image-link">
<span
style="margin: 0 0 20px 0; display: inline-block; vertical-align: middle; width: 100%;"
>
<a
target="_blank"
href="https://pikwizard.com/video/diverse-data-analytics-visualization-with-clock-overlay-in-motion/feae81afd0f79d9e329cf410f0980c69/"
style="text-decoration: none; font-size: 10px; margin: 0;"
>
<video controls style="width: 100%; margin: 0;">
<source src="https://player.vimeo.com/progressive_redirect/playback/769023305/rendition/240p/file.mp4?loc=external&oauth2_token_id=1223210874&signature=ede47acbbd61b42410c7431edd97ac4de133f24d4120f477f1e24c8c0b728164" type="video/mp4"
poster="https://pikwizard.com/pw/medium/feae81afd0f79d9e329cf410f0980c69.jpg"/>
Your browser does not support the video tag.
</video>
<p style="font-size: 12px; margin: 0;">PikWizard</p>
</a>
</span>
</span>
Free (free of charge)
Free for personal and commercial use.
Author: Awesome Content