
- Home >
- Stock Videos >
- Dynamic Analytics Graphics Merging Covid-19 Data and Business Insights
Dynamic Analytics Graphics Merging Covid-19 Data and Business Insights Video

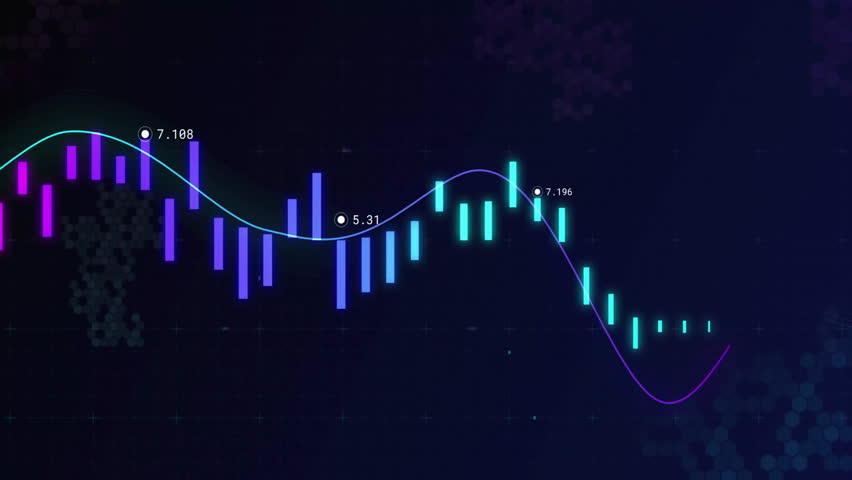
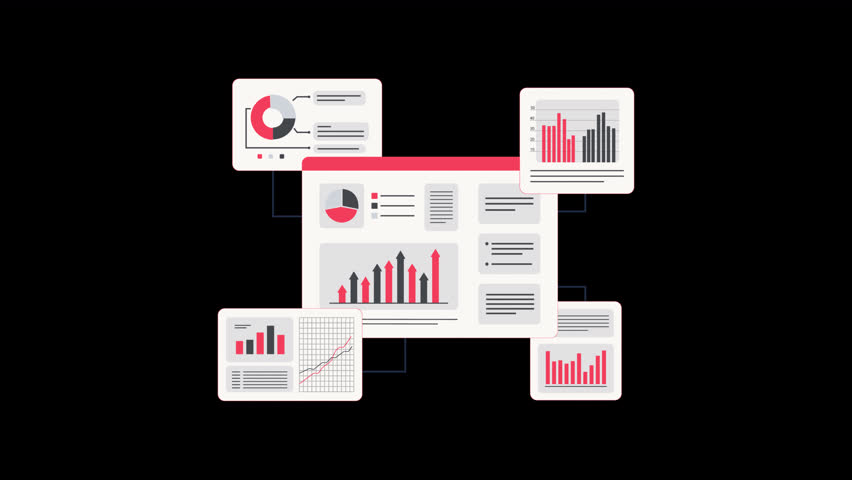
The graphic creatively merges Covid-19 cellular videory with an array of business analytics featuring statistical graphs, bar charts, and circular diagrams, offering a visual representation of the impact of the pandemic on economic data trends. Ideal for business presentations, academic research, pandemic impact analysis, and visual enhancements for financial reports.
Powered by  - Get 15% off with code: PIKWIZARD15


0
downloads
downloads
Tags:
More
Credit Photo
If you would like to credit the Photo, here are some ways you can do so
Text Link
video Link
<span class="text-link">
<span>
<a target="_blank" href=https://pikwizard.com/video/dynamic-analytics-graphics-merging-covid-19-data-and-business-insights/aa961e7bda274b246aef410894b15330/>PikWizard</a>
</span>
</span>
<span class="image-link">
<span
style="margin: 0 0 20px 0; display: inline-block; vertical-align: middle; width: 100%;"
>
<a
target="_blank"
href="https://pikwizard.com/video/dynamic-analytics-graphics-merging-covid-19-data-and-business-insights/aa961e7bda274b246aef410894b15330/"
style="text-decoration: none; font-size: 10px; margin: 0;"
>
<video controls style="width: 100%; margin: 0;">
<source src="https://player.vimeo.com/progressive_redirect/playback/736161280/rendition/240p/file.mp4?loc=external&oauth2_token_id=1223210874&signature=e6dbf36f761677525d5222750303978d02a07d010a661a209d652b2f6dddd106" type="video/mp4"
poster="https://pikwizard.com/pw/medium/aa961e7bda274b246aef410894b15330.jpg"/>
Your browser does not support the video tag.
</video>
<p style="font-size: 12px; margin: 0;">PikWizard</p>
</a>
</span>
</span>
Free (free of charge)
Free for personal and commercial use.
Author: Awesome Content