
- Home >
- Stock Videos >
- Dynamic Animation of Financial Data Processing in Green Display
Dynamic Animation of Financial Data Processing in Green Display Video
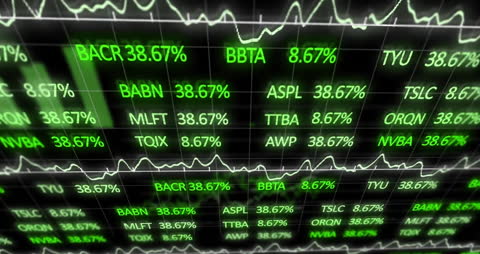
Animation depicting fluctuating financial data with percentages in green over a black grid background. Suitable for illustrating concepts related to global finance, stock market activity, data analysis, trading platforms, and financial technology. Ideal for use in presentations, reports, and educational content focusing on economics and financial systems.
Powered by  - Get 15% off with code: PIKWIZARD15


downloads
Tags:
More
Credit Photo
If you would like to credit the Photo, here are some ways you can do so
Text Link
video Link
<span class="text-link">
<span>
<a target="_blank" href=https://pikwizard.com/video/dynamic-animation-of-financial-data-processing-in-green-display/5fe06b315e7822dcdffbaa7b6e0da63f/>PikWizard</a>
</span>
</span>
<span class="image-link">
<span
style="margin: 0 0 20px 0; display: inline-block; vertical-align: middle; width: 100%;"
>
<a
target="_blank"
href="https://pikwizard.com/video/dynamic-animation-of-financial-data-processing-in-green-display/5fe06b315e7822dcdffbaa7b6e0da63f/"
style="text-decoration: none; font-size: 10px; margin: 0;"
>
<video controls style="width: 100%; margin: 0;">
<source src="https://player.vimeo.com/progressive_redirect/playback/907874575/rendition/240p/file.mp4?loc=external&oauth2_token_id=1223210874&signature=17d7b910c61c29f9527a32efb846022ff1c0434f6478d6620bac540e4a4bc320" type="video/mp4"
poster="https://pikwizard.com/pw/medium/5fe06b315e7822dcdffbaa7b6e0da63f.jpg"/>
Your browser does not support the video tag.
</video>
<p style="font-size: 12px; margin: 0;">PikWizard</p>
</a>
</span>
</span>
Free (free of charge)
Free for personal and commercial use.
Author: Awesome Content