
- Home >
- Stock Videos >
- Dynamic Animation of Financial Data Visualization with Trend Line
Dynamic Animation of Financial Data Visualization with Trend Line Video
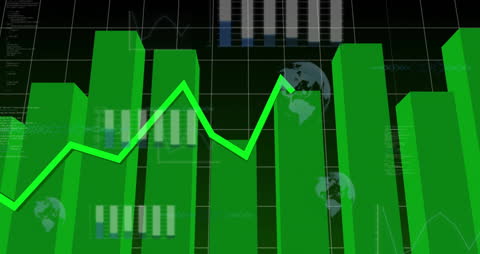
Animation shows green bars and a trend line on a digital interface, representing data analysis and global finance trends. Suitable for illustrating financial growth concepts, real-time data analysis, business reports, investment strategies, and dynamic digital presentations.
Powered by  - Get 15% off with code: PIKWIZARD15


0
downloads
downloads
Tags:
More
Credit Photo
If you would like to credit the Photo, here are some ways you can do so
Text Link
video Link
<span class="text-link">
<span>
<a target="_blank" href=https://pikwizard.com/video/dynamic-animation-of-financial-data-visualization-with-trend-line/5754433c84f9b958e183c9bc5c6c4c34/>PikWizard</a>
</span>
</span>
<span class="image-link">
<span
style="margin: 0 0 20px 0; display: inline-block; vertical-align: middle; width: 100%;"
>
<a
target="_blank"
href="https://pikwizard.com/video/dynamic-animation-of-financial-data-visualization-with-trend-line/5754433c84f9b958e183c9bc5c6c4c34/"
style="text-decoration: none; font-size: 10px; margin: 0;"
>
<video controls style="width: 100%; margin: 0;">
<source src="https://player.vimeo.com/progressive_redirect/playback/910986656/rendition/240p/file.mp4?loc=external&oauth2_token_id=1223210874&signature=d2fe5b2b8857c28c9e61c3e1985aff9ea5b404eb49cf80facb354d1dd840d706" type="video/mp4"
poster="https://pikwizard.com/pw/medium/5754433c84f9b958e183c9bc5c6c4c34.jpg"/>
Your browser does not support the video tag.
</video>
<p style="font-size: 12px; margin: 0;">PikWizard</p>
</a>
</span>
</span>
Free (free of charge)
Free for personal and commercial use.
Author: Awesome Content