
- Home >
- Stock Videos >
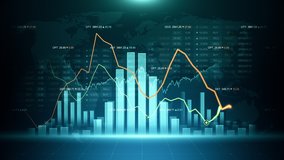
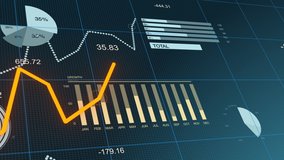
- Dynamic Animation of Financial Graph Analysis with Numerical Trends
Dynamic Animation of Financial Graph Analysis with Numerical Trends Video

Visual representation of financial data enhances understanding of stock market analytics, making it ideal for presentations. It illustrates investment trends and economic growth for educational purposes.
Powered by  - Get 15% off with code: PIKWIZARD15


0
downloads
downloads
Tags:
More
Credit Photo
If you would like to credit the Photo, here are some ways you can do so
Text Link
video Link
<span class="text-link">
<span>
<a target="_blank" href=https://pikwizard.com/video/dynamic-animation-of-financial-graph-analysis-with-numerical-trends/a64f7cf498b7bb6e57ab2c6a0b5cf77d/>PikWizard</a>
</span>
</span>
<span class="image-link">
<span
style="margin: 0 0 20px 0; display: inline-block; vertical-align: middle; width: 100%;"
>
<a
target="_blank"
href="https://pikwizard.com/video/dynamic-animation-of-financial-graph-analysis-with-numerical-trends/a64f7cf498b7bb6e57ab2c6a0b5cf77d/"
style="text-decoration: none; font-size: 10px; margin: 0;"
>
<video controls style="width: 100%; margin: 0;">
<source src="https://player.vimeo.com/progressive_redirect/playback/1073736196/rendition/240p/file.mp4?loc=external&oauth2_token_id=1223210874&signature=d30d090f03056eeccdbc75e80de222138d18f8cda8a22be8413d62ce319005e3" type="video/mp4"
poster="https://pikwizard.com/pw/medium/a64f7cf498b7bb6e57ab2c6a0b5cf77d.jpg"/>
Your browser does not support the video tag.
</video>
<p style="font-size: 12px; margin: 0;">PikWizard</p>
</a>
</span>
</span>
Free (free of charge)
Free for personal and commercial use.
Author: Awesome Content