
- Home >
- Stock Videos >
- Dynamic Animation of Stock Market Price Fluctuations
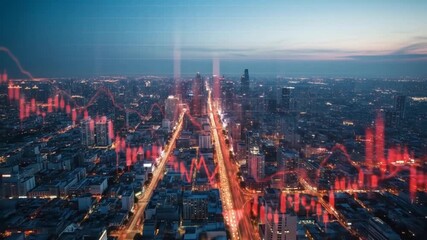
Dynamic Animation of Stock Market Price Fluctuations Video

This video presents an animated sequence of fluctuating stock market prices overlaid with data processing elements. Illuminated numbers and codes represent the volatility and real-time dynamics of financial markets. Ideal for use in finance-related projects, digital technology features, or educational content exploring how stock exchanges and economic indicators function in a globalized world.
Powered by 


1
downloads
downloads
Tags:
More
Credit Photo
If you would like to credit the Photo, here are some ways you can do so
Text Link
video Link
<span class="text-link">
<span>
<a target="_blank" href=https://pikwizard.com/video/dynamic-animation-of-stock-market-price-fluctuations/a7a22a49353d90cd9cd5350d759f8808/>PikWizard</a>
</span>
</span>
<span class="image-link">
<span
style="margin: 0 0 20px 0; display: inline-block; vertical-align: middle; width: 100%;"
>
<a
target="_blank"
href="https://pikwizard.com/video/dynamic-animation-of-stock-market-price-fluctuations/a7a22a49353d90cd9cd5350d759f8808/"
style="text-decoration: none; font-size: 10px; margin: 0;"
>
<video controls style="width: 100%; margin: 0;">
<source src="https://player.vimeo.com/progressive_redirect/playback/744520935/rendition/240p/file.mp4?loc=external&oauth2_token_id=1223210874&signature=090948516a93a0359e83a6613566bf11667c0c35dc5f80128e405d9e8c6cd999" type="video/mp4"
poster="https://pikwizard.com/pw/medium/a7a22a49353d90cd9cd5350d759f8808.jpg"/>
Your browser does not support the video tag.
</video>
<p style="font-size: 12px; margin: 0;">PikWizard</p>
</a>
</span>
</span>
Free (free of charge)
Free for personal and commercial use.
Author: Awesome Content