
- Home >
- Stock Videos >
- Dynamic Bar Chart Animation Underneath Digital Globe
Dynamic Bar Chart Animation Underneath Digital Globe Video
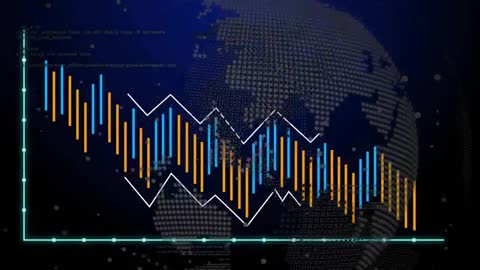
Animation depicts an evolving bar chart with changing data beneath a rotating globe made of digital dots, indicating market trends. Suited for projects involving financial analytics, technological presentations, and digital graphic displays. Ideal for videos on data analysis and trends.
Powered by 


downloads
Tags:
More
Credit Photo
If you would like to credit the Photo, here are some ways you can do so
Text Link
video Link
<span class="text-link">
<span>
<a target="_blank" href=https://pikwizard.com/video/dynamic-bar-chart-animation-underneath-digital-globe/78422c82b741a5675750a6e557dc4268/>PikWizard</a>
</span>
</span>
<span class="image-link">
<span
style="margin: 0 0 20px 0; display: inline-block; vertical-align: middle; width: 100%;"
>
<a
target="_blank"
href="https://pikwizard.com/video/dynamic-bar-chart-animation-underneath-digital-globe/78422c82b741a5675750a6e557dc4268/"
style="text-decoration: none; font-size: 10px; margin: 0;"
>
<video controls style="width: 100%; margin: 0;">
<source src="https://player.vimeo.com/progressive_redirect/playback/1103516664/rendition/240p/file.mp4?loc=external&oauth2_token_id=1223210874&signature=61e88770f8a45eb9d98928b471ce747d0d93509586e47927b2b74874b9058062" type="video/mp4"
poster="https://pikwizard.com/pw/medium/78422c82b741a5675750a6e557dc4268.jpg"/>
Your browser does not support the video tag.
</video>
<p style="font-size: 12px; margin: 0;">PikWizard</p>
</a>
</span>
</span>
Free (free of charge)
Free for personal and commercial use.
Author: Awesome Content