
- Home >
- Stock Videos >
- Dynamic Data Visualization in Red Tones with Codes
Dynamic Data Visualization in Red Tones with Codes Video

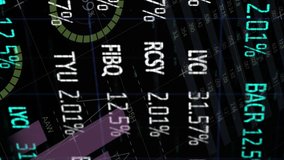
This visual portrays dynamic data processing related to the stock market, featuring code scripts and graphical elements like graphs and pie charts. The dominant red color palette adds an intensity that enhances the digital theme, appealing to scenarios involving business analysis, financial reports, and tech networking. Ideal for presentations or articles focused on data systems or finance training sessions.
Powered by  - Get 15% off with code: PIKWIZARD15


downloads
Tags:
More
Credit Photo
If you would like to credit the Photo, here are some ways you can do so
Text Link
video Link
<span class="text-link">
<span>
<a target="_blank" href=https://pikwizard.com/video/dynamic-data-visualization-in-red-tones-with-codes/e77e251ec83516a980dd6804f2dbe2a5/>PikWizard</a>
</span>
</span>
<span class="image-link">
<span
style="margin: 0 0 20px 0; display: inline-block; vertical-align: middle; width: 100%;"
>
<a
target="_blank"
href="https://pikwizard.com/video/dynamic-data-visualization-in-red-tones-with-codes/e77e251ec83516a980dd6804f2dbe2a5/"
style="text-decoration: none; font-size: 10px; margin: 0;"
>
<video controls style="width: 100%; margin: 0;">
<source src="https://player.vimeo.com/progressive_redirect/playback/759657940/rendition/240p/file.mp4?loc=external&oauth2_token_id=1223210874&signature=5cdb6766567e8fcfbc37a0d766f816e19afcb7bd63d0677104db9864e1a1fcef" type="video/mp4"
poster="https://pikwizard.com/pw/medium/e77e251ec83516a980dd6804f2dbe2a5.jpg"/>
Your browser does not support the video tag.
</video>
<p style="font-size: 12px; margin: 0;">PikWizard</p>
</a>
</span>
</span>
Free (free of charge)
Free for personal and commercial use.
Author: Awesome Content