
- Home >
- Stock Videos >
- Dynamic Data Visualization Interface with Live Monitoring
Dynamic Data Visualization Interface with Live Monitoring Video
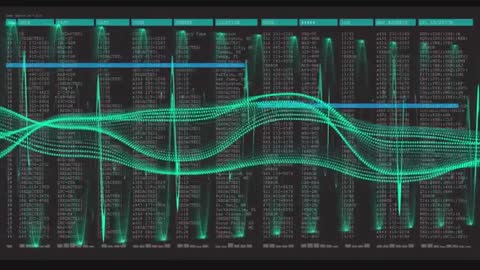
This visualization shows a dynamic digital interface displaying real-time data through tables and pulsing waveforms. The blue bar moving across rows indicates an active data monitoring process within an analytical setting. Perfect for illustrating themes of high-tech environments, ongoing surveillance, data technology presentations, and high-stakes tech sectors visualizations.
Powered by  - Get 15% off with code: PIKWIZARD15


downloads
Tags:
More
Credit Photo
If you would like to credit the Photo, here are some ways you can do so
Text Link
video Link
<span class="text-link">
<span>
<a target="_blank" href=https://pikwizard.com/video/dynamic-data-visualization-interface-with-live-monitoring/99734442244752bb47af5bb7d9f0498e/>PikWizard</a>
</span>
</span>
<span class="image-link">
<span
style="margin: 0 0 20px 0; display: inline-block; vertical-align: middle; width: 100%;"
>
<a
target="_blank"
href="https://pikwizard.com/video/dynamic-data-visualization-interface-with-live-monitoring/99734442244752bb47af5bb7d9f0498e/"
style="text-decoration: none; font-size: 10px; margin: 0;"
>
<video controls style="width: 100%; margin: 0;">
<source src="https://player.vimeo.com/progressive_redirect/playback/1086953185/rendition/540p/file.mp4?loc=external&oauth2_token_id=1223210874&signature=e600b902a022ac13b638f659722436093bbd49f80238cb3f33f9469a34f725ca" type="video/mp4"
poster="https://pikwizard.com/pw/medium/99734442244752bb47af5bb7d9f0498e.jpg"/>
Your browser does not support the video tag.
</video>
<p style="font-size: 12px; margin: 0;">PikWizard</p>
</a>
</span>
</span>
Free (free of charge)
Free for personal and commercial use.
Author: Awesome Content