
- Home >
- Stock Videos >
- Dynamic Data Visualization on Digital Interface Displaying Data Trends
Dynamic Data Visualization on Digital Interface Displaying Data Trends Video
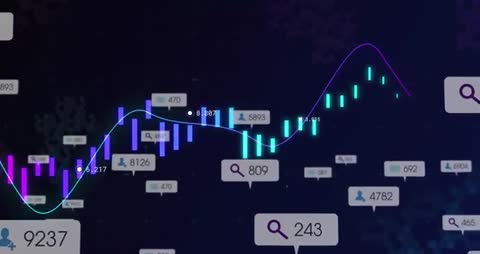
Vivid depiction of data points, purple and cyan bars, numbers convey analytics on a digital screen. Innovative presentation transforms statistics into approachable graphics. Useful for presentations, reports, online courses on data analysis, investing, or business intelligence to enhance user understanding of complex information.

downloads
Tags:
More
Credit Photo
If you would like to credit the Photo, here are some ways you can do so
Text Link
video Link
<span class="text-link">
<span>
<a target="_blank" href=https://pikwizard.com/video/dynamic-data-visualization-on-digital-interface-displaying-data-trends/d32f8c83ffb35363cc871231f4b499c5/>PikWizard</a>
</span>
</span>
<span class="image-link">
<span
style="margin: 0 0 20px 0; display: inline-block; vertical-align: middle; width: 100%;"
>
<a
target="_blank"
href="https://pikwizard.com/video/dynamic-data-visualization-on-digital-interface-displaying-data-trends/d32f8c83ffb35363cc871231f4b499c5/"
style="text-decoration: none; font-size: 10px; margin: 0;"
>
<video controls style="width: 100%; margin: 0;">
<source src="https://player.vimeo.com/progressive_redirect/playback/1094225120/rendition/240p/file.mp4?loc=external&oauth2_token_id=1223210874&signature=8a138088693ab590ce12787efa9d3b601f62cfecaefe95a372e4b6b69fe8cfde" type="video/mp4"
poster="https://pikwizard.com/pw/medium/d32f8c83ffb35363cc871231f4b499c5.jpg"/>
Your browser does not support the video tag.
</video>
<p style="font-size: 12px; margin: 0;">PikWizard</p>
</a>
</span>
</span>
Free (free of charge)
Free for personal and commercial use.
Author: Awesome Content