
- Home >
- Stock Videos >
- Dynamic Data Visualization with Charts and Graphs
Dynamic Data Visualization with Charts and Graphs Video
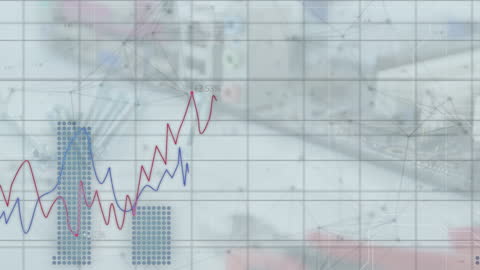
Dynamic depiction of data processing represents the intersection of technology and finance. With ascending lines indicating growth and scattered data points reflecting statistical analysis, it is ideal for illustrating trends or explaining complex business intelligence. Suitable for marketing, reports, educational materials, presentations on economic models, or financial predictions.

downloads
Tags:
More
Credit Photo
If you would like to credit the Photo, here are some ways you can do so
Text Link
video Link
<span class="text-link">
<span>
<a target="_blank" href=https://pikwizard.com/video/dynamic-data-visualization-with-charts-and-graphs/90376f7694ca5d702a009722d505b115/>PikWizard</a>
</span>
</span>
<span class="image-link">
<span
style="margin: 0 0 20px 0; display: inline-block; vertical-align: middle; width: 100%;"
>
<a
target="_blank"
href="https://pikwizard.com/video/dynamic-data-visualization-with-charts-and-graphs/90376f7694ca5d702a009722d505b115/"
style="text-decoration: none; font-size: 10px; margin: 0;"
>
<video controls style="width: 100%; margin: 0;">
<source src="https://player.vimeo.com/progressive_redirect/playback/908019763/rendition/240p/file.mp4?loc=external&oauth2_token_id=1223210874&signature=ab721bbfd781ba943afae73ca53379987f3ddbcb24315d1907250fce10f16f72" type="video/mp4"
poster="https://pikwizard.com/pw/medium/90376f7694ca5d702a009722d505b115.jpg"/>
Your browser does not support the video tag.
</video>
<p style="font-size: 12px; margin: 0;">PikWizard</p>
</a>
</span>
</span>
Free (free of charge)
Free for personal and commercial use.
Author: Awesome Content