
- Home >
- Stock Videos >
- Dynamic Data Visualization with Graph and Statistics
Dynamic Data Visualization with Graph and Statistics Video
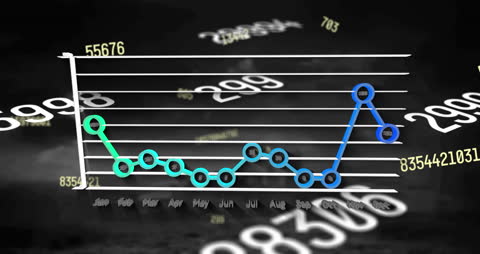
Animation showcases fluctuating data trends set against a dark background with highlighted statistics. Ideal for business presentations, infographics, and tutorials explaining data analysis or illustrating performance metrics.

downloads
Tags:
More
Credit Photo
If you would like to credit the Photo, here are some ways you can do so
Text Link
video Link
<span class="text-link">
<span>
<a target="_blank" href=https://pikwizard.com/video/dynamic-data-visualization-with-graph-and-statistics/d19deb5b8ab306ce574b6dd8895bef73/>PikWizard</a>
</span>
</span>
<span class="image-link">
<span
style="margin: 0 0 20px 0; display: inline-block; vertical-align: middle; width: 100%;"
>
<a
target="_blank"
href="https://pikwizard.com/video/dynamic-data-visualization-with-graph-and-statistics/d19deb5b8ab306ce574b6dd8895bef73/"
style="text-decoration: none; font-size: 10px; margin: 0;"
>
<video controls style="width: 100%; margin: 0;">
<source src="https://player.vimeo.com/progressive_redirect/playback/722031599/rendition/240p/file.mp4?loc=external&oauth2_token_id=1223210874&signature=d850f16dc305137fe935f5ff27cb6771c429a56762aa06021724cbd8002f5750" type="video/mp4"
poster="https://pikwizard.com/pw/medium/d19deb5b8ab306ce574b6dd8895bef73.jpg"/>
Your browser does not support the video tag.
</video>
<p style="font-size: 12px; margin: 0;">PikWizard</p>
</a>
</span>
</span>
Free (free of charge)
Free for personal and commercial use.
Author: Awesome Content