
- Home >
- Stock Videos >
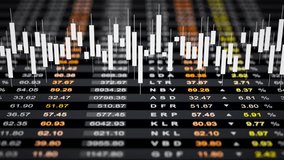
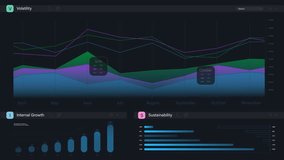
- Dynamic Digital Data Visualization with Financial Graphs
Dynamic Digital Data Visualization with Financial Graphs Video
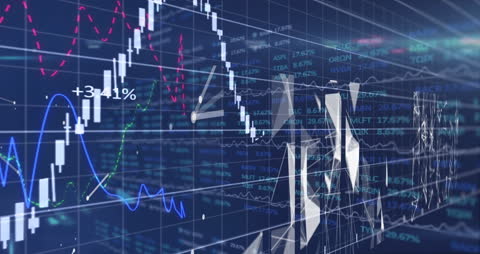
This visual showcases dynamic data visualization with financial graphs, a powerful representation of data processing in a digital format. Arrows and fluctuating graphs suggest a highly analytical and finance-focused theme, ideal for use in business presentations, educational materials, or as a background in technology-themed media. Perfect for illustrating concepts of data analysis and financial market fluctuations in a compelling, digital context.
Powered by  - Get 15% off with code: PIKWIZARD15


downloads
Tags:
More
Credit Photo
If you would like to credit the Photo, here are some ways you can do so
Text Link
video Link
<span class="text-link">
<span>
<a target="_blank" href=https://pikwizard.com/video/dynamic-digital-data-visualization-with-financial-graphs/3b9d8f8316575244c41c510782980648/>PikWizard</a>
</span>
</span>
<span class="image-link">
<span
style="margin: 0 0 20px 0; display: inline-block; vertical-align: middle; width: 100%;"
>
<a
target="_blank"
href="https://pikwizard.com/video/dynamic-digital-data-visualization-with-financial-graphs/3b9d8f8316575244c41c510782980648/"
style="text-decoration: none; font-size: 10px; margin: 0;"
>
<video controls style="width: 100%; margin: 0;">
<source src="https://player.vimeo.com/progressive_redirect/playback/912086436/rendition/240p/file.mp4?loc=external&oauth2_token_id=1223210874&signature=c26c93186c7833e75bb4073b0026fa931547ff46360afa0657fd54430ef54f6a" type="video/mp4"
poster="https://pikwizard.com/pw/medium/3b9d8f8316575244c41c510782980648.jpg"/>
Your browser does not support the video tag.
</video>
<p style="font-size: 12px; margin: 0;">PikWizard</p>
</a>
</span>
</span>
Free (free of charge)
Free for personal and commercial use.
Author: Awesome Content