
- Home >
- Stock Videos >
- Dynamic Digital Financial Data Analysis Visualization
Dynamic Digital Financial Data Analysis Visualization Video
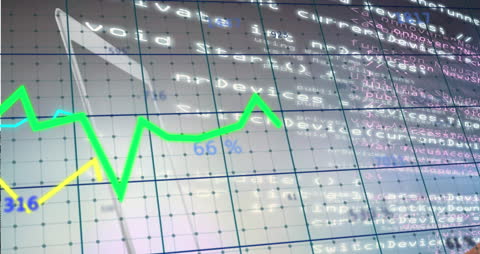
Abstract animation depicts complex financial data analysis with vivid graphs overlaid on a grid network, symbolizing modern technology's role in business decision-making. Useful for illustrating advanced data processing concepts in financial publications, technology blogs, or presentations.

downloads
Tags:
More
Credit Photo
If you would like to credit the Photo, here are some ways you can do so
Text Link
video Link
<span class="text-link">
<span>
<a target="_blank" href=https://pikwizard.com/video/dynamic-digital-financial-data-analysis-visualization/a3785d06fa337e9fc23421ed8912203f/>PikWizard</a>
</span>
</span>
<span class="image-link">
<span
style="margin: 0 0 20px 0; display: inline-block; vertical-align: middle; width: 100%;"
>
<a
target="_blank"
href="https://pikwizard.com/video/dynamic-digital-financial-data-analysis-visualization/a3785d06fa337e9fc23421ed8912203f/"
style="text-decoration: none; font-size: 10px; margin: 0;"
>
<video controls style="width: 100%; margin: 0;">
<source src="https://player.vimeo.com/progressive_redirect/playback/887540860/rendition/540p/file.mp4?loc=external&oauth2_token_id=1223210874&signature=65762ab11ae09f06e8921eb48062f541f7677e857ec9dace781728e8f8ec31f3" type="video/mp4"
poster="https://pikwizard.com/pw/medium/a3785d06fa337e9fc23421ed8912203f.jpg"/>
Your browser does not support the video tag.
</video>
<p style="font-size: 12px; margin: 0;">PikWizard</p>
</a>
</span>
</span>
Free (free of charge)
Free for personal and commercial use.
Author: Awesome Content