
- Home >
- Stock Videos >
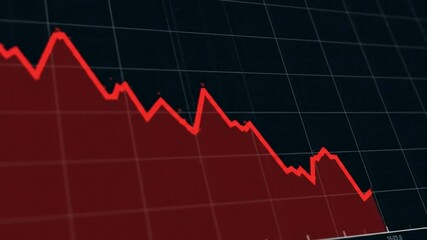
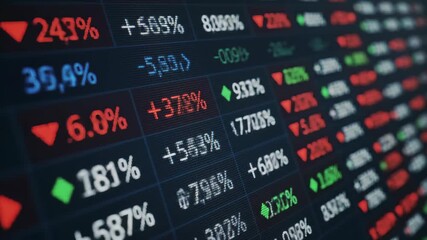
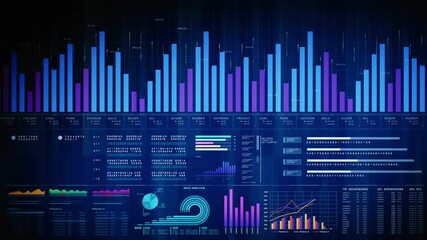
- Dynamic Digital Financial Data Animation with Stock Market Trends
Dynamic Digital Financial Data Animation with Stock Market Trends Video
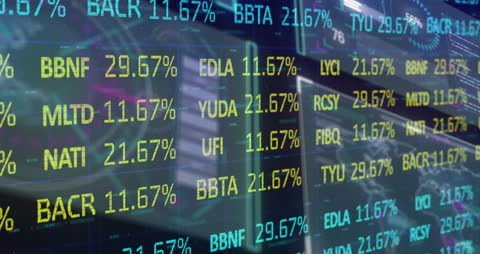
The vibrant selection showcases a dynamic digital screen with financial data and stock market trends. Highlighting fluctuating percentages and an array of enterprise symbols, it offers a compelling representation of global financial dynamics and continual market variations. By using animated graphics and highlighting critical financial parameters, this content is ideal for use in business presentations, financial reports, and educational material about market behaviors and investment strategies.
Powered by 


1
downloads
downloads
Tags:
More
Credit Photo
If you would like to credit the Photo, here are some ways you can do so
Text Link
video Link
<span class="text-link">
<span>
<a target="_blank" href=https://pikwizard.com/video/dynamic-digital-financial-data-animation-with-stock-market-trends/f1e0b7532c71c0edaeeec9946b8e04f8/>PikWizard</a>
</span>
</span>
<span class="image-link">
<span
style="margin: 0 0 20px 0; display: inline-block; vertical-align: middle; width: 100%;"
>
<a
target="_blank"
href="https://pikwizard.com/video/dynamic-digital-financial-data-animation-with-stock-market-trends/f1e0b7532c71c0edaeeec9946b8e04f8/"
style="text-decoration: none; font-size: 10px; margin: 0;"
>
<video controls style="width: 100%; margin: 0;">
<source src="https://player.vimeo.com/progressive_redirect/playback/746264062/rendition/240p/file.mp4?loc=external&oauth2_token_id=1223210874&signature=5b666c09fc272bb46bd6392f10c3daa6fd706c44e9c9e54e10eeb03e81bcc155" type="video/mp4"
poster="https://pikwizard.com/pw/medium/f1e0b7532c71c0edaeeec9946b8e04f8.jpg"/>
Your browser does not support the video tag.
</video>
<p style="font-size: 12px; margin: 0;">PikWizard</p>
</a>
</span>
</span>
Free (free of charge)
Free for personal and commercial use.
Author: Awesome Content