
- Home >
- Stock Videos >
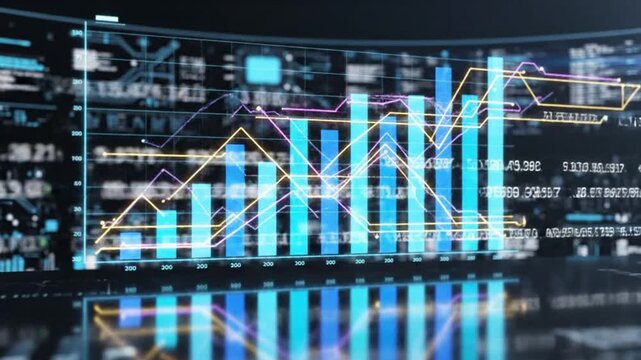
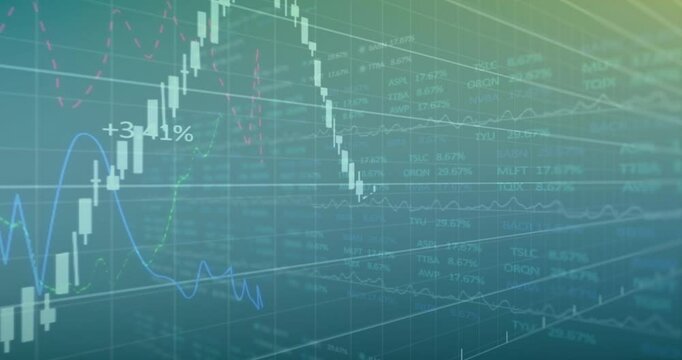
- Dynamic Digital Interface of Financial Data and Stock Market Analysis
Dynamic Digital Interface of Financial Data and Stock Market Analysis Video

This visualization represents financial data with a digital interface featuring stock market statistics and performance metrics. It is suitable for illustrating themes related to global finance, data analysis, and technological advancements in trading. Ideal for use in financial reports, presentations, or websites focused on investment and econometrics.
Powered by 


0
downloads
downloads
Tags:
More
Credit Photo
If you would like to credit the Photo, here are some ways you can do so
Text Link
video Link
<span class="text-link">
<span>
<a target="_blank" href=https://pikwizard.com/video/dynamic-digital-interface-of-financial-data-and-stock-market-analysis/ee40e976b6123434793980ae701e0f4e/>PikWizard</a>
</span>
</span>
<span class="image-link">
<span
style="margin: 0 0 20px 0; display: inline-block; vertical-align: middle; width: 100%;"
>
<a
target="_blank"
href="https://pikwizard.com/video/dynamic-digital-interface-of-financial-data-and-stock-market-analysis/ee40e976b6123434793980ae701e0f4e/"
style="text-decoration: none; font-size: 10px; margin: 0;"
>
<video controls style="width: 100%; margin: 0;">
<source src="https://player.vimeo.com/progressive_redirect/playback/826587879/rendition/240p/file.mp4?loc=external&oauth2_token_id=1223210874&signature=7506c12b2b5f43dad6b5c3ada82b03ef9507edb59990249ee76a6b43b760f4ac" type="video/mp4"
poster="https://pikwizard.com/pw/medium/ee40e976b6123434793980ae701e0f4e.jpg"/>
Your browser does not support the video tag.
</video>
<p style="font-size: 12px; margin: 0;">PikWizard</p>
</a>
</span>
</span>
Free (free of charge)
Free for personal and commercial use.
Author: Awesome Content