
- Home >
- Stock Videos >
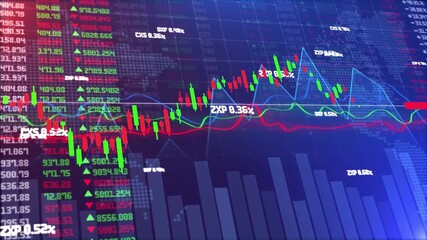
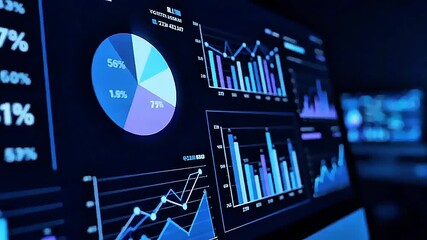
- Dynamic Digital Presentation with Financial Graph Animation
Dynamic Digital Presentation with Financial Graph Animation Video

Dynamic visual representation incorporating animated financial graphs and data points on dark backdrop. Subject focuses on economic trends, technology advancements highlighted by fluctuating stats over digital world map. Ideal for use in finance or tech presentations, educational materials, and business reports illuminating market dynamics.
Powered by 


downloads
Tags:
More
Credit Photo
If you would like to credit the Photo, here are some ways you can do so
Text Link
video Link
<span class="text-link">
<span>
<a target="_blank" href=https://pikwizard.com/video/dynamic-digital-presentation-with-financial-graph-animation/144f02e9c5d7f90f279847b257fc809b/>PikWizard</a>
</span>
</span>
<span class="image-link">
<span
style="margin: 0 0 20px 0; display: inline-block; vertical-align: middle; width: 100%;"
>
<a
target="_blank"
href="https://pikwizard.com/video/dynamic-digital-presentation-with-financial-graph-animation/144f02e9c5d7f90f279847b257fc809b/"
style="text-decoration: none; font-size: 10px; margin: 0;"
>
<video controls style="width: 100%; margin: 0;">
<source src="https://player.vimeo.com/progressive_redirect/playback/741295022/rendition/240p/file.mp4?loc=external&oauth2_token_id=1223210874&signature=b462a07bfccd9af443830177761edf003eb45c10255345e68ff53c3b90cfe518" type="video/mp4"
poster="https://pikwizard.com/pw/medium/144f02e9c5d7f90f279847b257fc809b.jpg"/>
Your browser does not support the video tag.
</video>
<p style="font-size: 12px; margin: 0;">PikWizard</p>
</a>
</span>
</span>
Free (free of charge)
Free for personal and commercial use.
Author: Awesome Content