
- Home >
- Stock Videos >
- Dynamic Display of Statistical Data Amidst Vibrant Rainbow Graphics
Dynamic Display of Statistical Data Amidst Vibrant Rainbow Graphics Video
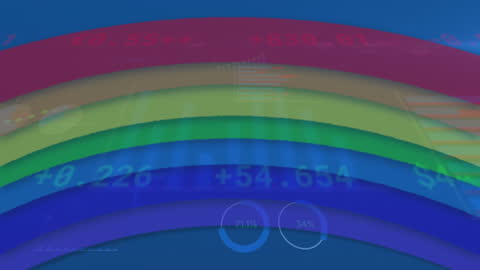
Colorful rainbow graphics blend with contemporary statistical visuals, symbolizing data processing and technology evolution. Suitable for illustrating technological advancements, financial analyses, and smart solutions in digital content creation.
Powered by  - Get 15% off with code: PIKWIZARD15


downloads
Tags:
More
Credit Photo
If you would like to credit the Photo, here are some ways you can do so
Text Link
video Link
<span class="text-link">
<span>
<a target="_blank" href=https://pikwizard.com/video/dynamic-display-of-statistical-data-amidst-vibrant-rainbow-graphics/aad50e9e1c92b8b16ae1ddcda61f87bd/>PikWizard</a>
</span>
</span>
<span class="image-link">
<span
style="margin: 0 0 20px 0; display: inline-block; vertical-align: middle; width: 100%;"
>
<a
target="_blank"
href="https://pikwizard.com/video/dynamic-display-of-statistical-data-amidst-vibrant-rainbow-graphics/aad50e9e1c92b8b16ae1ddcda61f87bd/"
style="text-decoration: none; font-size: 10px; margin: 0;"
>
<video controls style="width: 100%; margin: 0;">
<source src="https://player.vimeo.com/progressive_redirect/playback/775618060/rendition/240p/file.mp4?loc=external&oauth2_token_id=1223210874&signature=2077c26868fc2c5412593a884659826c8a39d08e7a4c053b67a96e1c57890c2d" type="video/mp4"
poster="https://pikwizard.com/pw/medium/aad50e9e1c92b8b16ae1ddcda61f87bd.jpg"/>
Your browser does not support the video tag.
</video>
<p style="font-size: 12px; margin: 0;">PikWizard</p>
</a>
</span>
</span>
Free (free of charge)
Free for personal and commercial use.
Author: Awesome Content
Similar Free Stock Videos
Loading...