
- Home >
- Stock Videos >
- Dynamic Display of Stock Market Data and Analytics
Dynamic Display of Stock Market Data and Analytics Video
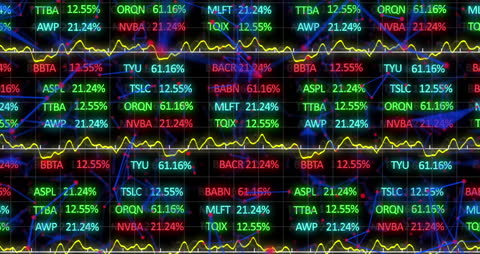
This vibrant illustration depicts real-time financial data overlay with graphical elements, showcasing the dynamic nature of modern stock markets. Ideal for illustrating concepts in digital content related to economics, stock trading strategies, finance courses, or business analytics presentations. Useful in creating engaging visuals for financial firms and investment advisors.
Powered by  - Get 15% off with code: PIKWIZARD15


downloads
Tags:
More
Credit Photo
If you would like to credit the Photo, here are some ways you can do so
Text Link
video Link
<span class="text-link">
<span>
<a target="_blank" href=https://pikwizard.com/video/dynamic-display-of-stock-market-data-and-analytics/91d3dd9a8b79a65ea90b17abebb3c870/>PikWizard</a>
</span>
</span>
<span class="image-link">
<span
style="margin: 0 0 20px 0; display: inline-block; vertical-align: middle; width: 100%;"
>
<a
target="_blank"
href="https://pikwizard.com/video/dynamic-display-of-stock-market-data-and-analytics/91d3dd9a8b79a65ea90b17abebb3c870/"
style="text-decoration: none; font-size: 10px; margin: 0;"
>
<video controls style="width: 100%; margin: 0;">
<source src="https://player.vimeo.com/progressive_redirect/playback/809946372/rendition/240p/file.mp4?loc=external&oauth2_token_id=1223210874&signature=7f6e5d6d10acf0551d4c05bb7aaabdab9fdd0b397a4f1ac22637f192bf4bada6" type="video/mp4"
poster="https://pikwizard.com/pw/medium/91d3dd9a8b79a65ea90b17abebb3c870.jpg"/>
Your browser does not support the video tag.
</video>
<p style="font-size: 12px; margin: 0;">PikWizard</p>
</a>
</span>
</span>
Free (free of charge)
Free for personal and commercial use.
Author: Awesome Content
Similar Free Stock Videos
Loading...