
- Home >
- Stock Videos >
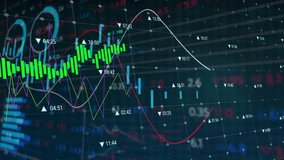
- Dynamic Display of Stock Market Data and Trends
Dynamic Display of Stock Market Data and Trends Video

Visual illustrating fluctuating stock prices using sharp upward and downward trend arrows on a digital screen. Useful for depicting financial reports, market analytics reports, business investment strategies, and economic forecasting.
Powered by  - Get 15% off with code: PIKWIZARD15


downloads
Tags:
More
Credit Photo
If you would like to credit the Photo, here are some ways you can do so
Text Link
video Link
<span class="text-link">
<span>
<a target="_blank" href=https://pikwizard.com/video/dynamic-display-of-stock-market-data-and-trends/09385c23f3c2cb5c84a4b4785fb012a7/>PikWizard</a>
</span>
</span>
<span class="image-link">
<span
style="margin: 0 0 20px 0; display: inline-block; vertical-align: middle; width: 100%;"
>
<a
target="_blank"
href="https://pikwizard.com/video/dynamic-display-of-stock-market-data-and-trends/09385c23f3c2cb5c84a4b4785fb012a7/"
style="text-decoration: none; font-size: 10px; margin: 0;"
>
<video controls style="width: 100%; margin: 0;">
<source src="https://player.vimeo.com/progressive_redirect/playback/1002152592/rendition/720p/file.mp4?loc=external&oauth2_token_id=1223210874&signature=fa815f53e0cf35ce9878210bcb396a9bbbf504e8244aa6994bcdea417c5cf351" type="video/mp4"
poster="https://pikwizard.com/pw/medium/09385c23f3c2cb5c84a4b4785fb012a7.jpg"/>
Your browser does not support the video tag.
</video>
<p style="font-size: 12px; margin: 0;">PikWizard</p>
</a>
</span>
</span>
Free (free of charge)
Free for personal and commercial use.
Author: Awesome Content