
- Home >
- Stock Videos >
- Dynamic Display of Stock Market Financial Data
Dynamic Display of Stock Market Financial Data Video
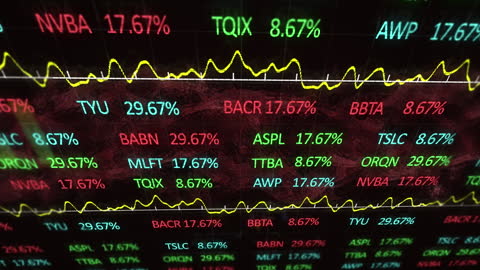
This video features a dynamic, digitally generated display typical of stock and trading markets. Colored numbers and graphs represent financial data, reflecting stock trends and investment activity. Useful for illustrating concepts related to finance, investment banking, global markets, economic forecasts, and business presentations.
Powered by 


1
downloads
downloads
Tags:
More
Credit Photo
If you would like to credit the Photo, here are some ways you can do so
Text Link
video Link
<span class="text-link">
<span>
<a target="_blank" href=https://pikwizard.com/video/dynamic-display-of-stock-market-financial-data/a0eae745bbf3475a5ac4c238b48111ca/>PikWizard</a>
</span>
</span>
<span class="image-link">
<span
style="margin: 0 0 20px 0; display: inline-block; vertical-align: middle; width: 100%;"
>
<a
target="_blank"
href="https://pikwizard.com/video/dynamic-display-of-stock-market-financial-data/a0eae745bbf3475a5ac4c238b48111ca/"
style="text-decoration: none; font-size: 10px; margin: 0;"
>
<video controls style="width: 100%; margin: 0;">
<source src="https://player.vimeo.com/progressive_redirect/playback/752874900/rendition/240p/file.mp4?loc=external&oauth2_token_id=1223210874&signature=548bea02bff8a17ad30142866a2a71b6cf37419507f698d152d270d69aea87bf" type="video/mp4"
poster="https://pikwizard.com/pw/medium/a0eae745bbf3475a5ac4c238b48111ca.jpg"/>
Your browser does not support the video tag.
</video>
<p style="font-size: 12px; margin: 0;">PikWizard</p>
</a>
</span>
</span>
Free (free of charge)
Free for personal and commercial use.
Author: Awesome Content