
- Home >
- Stock Videos >
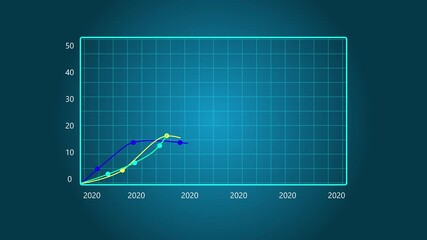
- Dynamic Finance Chart with Data Visualizations
Dynamic Finance Chart with Data Visualizations Video
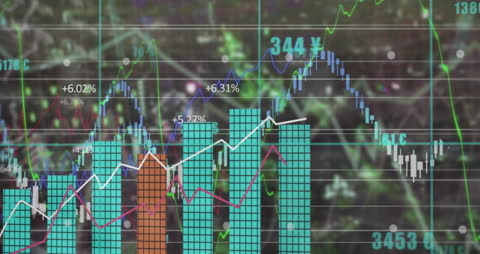
Dynamic representation of statistics and financial data depicts market trends and trading analysis. Vibrant color-coded graphs enhance understanding of complex financial information, supporting economic and business studies, presentations, and technological developments.
Powered by 


downloads
Tags:
More
Credit Photo
If you would like to credit the Photo, here are some ways you can do so
Text Link
video Link
<span class="text-link">
<span>
<a target="_blank" href=https://pikwizard.com/video/dynamic-finance-chart-with-data-visualizations/3a947e60ee23d27f8282189e3a7b2458/>PikWizard</a>
</span>
</span>
<span class="image-link">
<span
style="margin: 0 0 20px 0; display: inline-block; vertical-align: middle; width: 100%;"
>
<a
target="_blank"
href="https://pikwizard.com/video/dynamic-finance-chart-with-data-visualizations/3a947e60ee23d27f8282189e3a7b2458/"
style="text-decoration: none; font-size: 10px; margin: 0;"
>
<video controls style="width: 100%; margin: 0;">
<source src="https://player.vimeo.com/progressive_redirect/playback/774979360/rendition/240p/file.mp4?loc=external&oauth2_token_id=1223210874&signature=64509d06173eb64ffa8f6fffc38f4cddb6514657718b2447ad65a2a8957f1128" type="video/mp4"
poster="https://pikwizard.com/pw/medium/3a947e60ee23d27f8282189e3a7b2458.jpg"/>
Your browser does not support the video tag.
</video>
<p style="font-size: 12px; margin: 0;">PikWizard</p>
</a>
</span>
</span>
Free (free of charge)
Free for personal and commercial use.
Author: Awesome Content