
- Home >
- Stock Videos >
- Dynamic Financial Analytics Graph With Red Descending Line
Dynamic Financial Analytics Graph With Red Descending Line Video
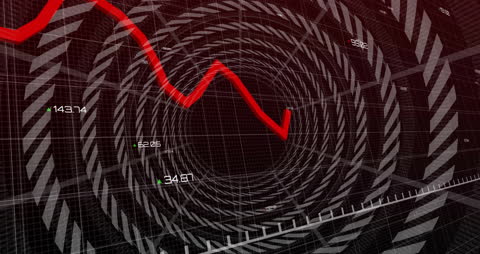
Illustrating fluctuating stock market trends, this visualization uses distinctive circles and a bold red declining line. Ideal for presentations on market research, economic forecasting, or as a visual aid in explaining negative economic indicators and investment strategies.
Powered by  - Get 15% off with code: PIKWIZARD15


downloads
Tags:
More
Credit Photo
If you would like to credit the Photo, here are some ways you can do so
Text Link
video Link
<span class="text-link">
<span>
<a target="_blank" href=https://pikwizard.com/video/dynamic-financial-analytics-graph-with-red-descending-line/c835bb5133f1d6719e381d12ba05a17c/>PikWizard</a>
</span>
</span>
<span class="image-link">
<span
style="margin: 0 0 20px 0; display: inline-block; vertical-align: middle; width: 100%;"
>
<a
target="_blank"
href="https://pikwizard.com/video/dynamic-financial-analytics-graph-with-red-descending-line/c835bb5133f1d6719e381d12ba05a17c/"
style="text-decoration: none; font-size: 10px; margin: 0;"
>
<video controls style="width: 100%; margin: 0;">
<source src="https://player.vimeo.com/progressive_redirect/playback/901430339/rendition/240p/file.mp4?loc=external&oauth2_token_id=1223210874&signature=2976cac6372ec58e888b94b3e04bc011a993761e7ccd44e69e871c88510de182" type="video/mp4"
poster="https://pikwizard.com/pw/medium/c835bb5133f1d6719e381d12ba05a17c.jpg"/>
Your browser does not support the video tag.
</video>
<p style="font-size: 12px; margin: 0;">PikWizard</p>
</a>
</span>
</span>
Free (free of charge)
Free for personal and commercial use.
Author: Awesome Content